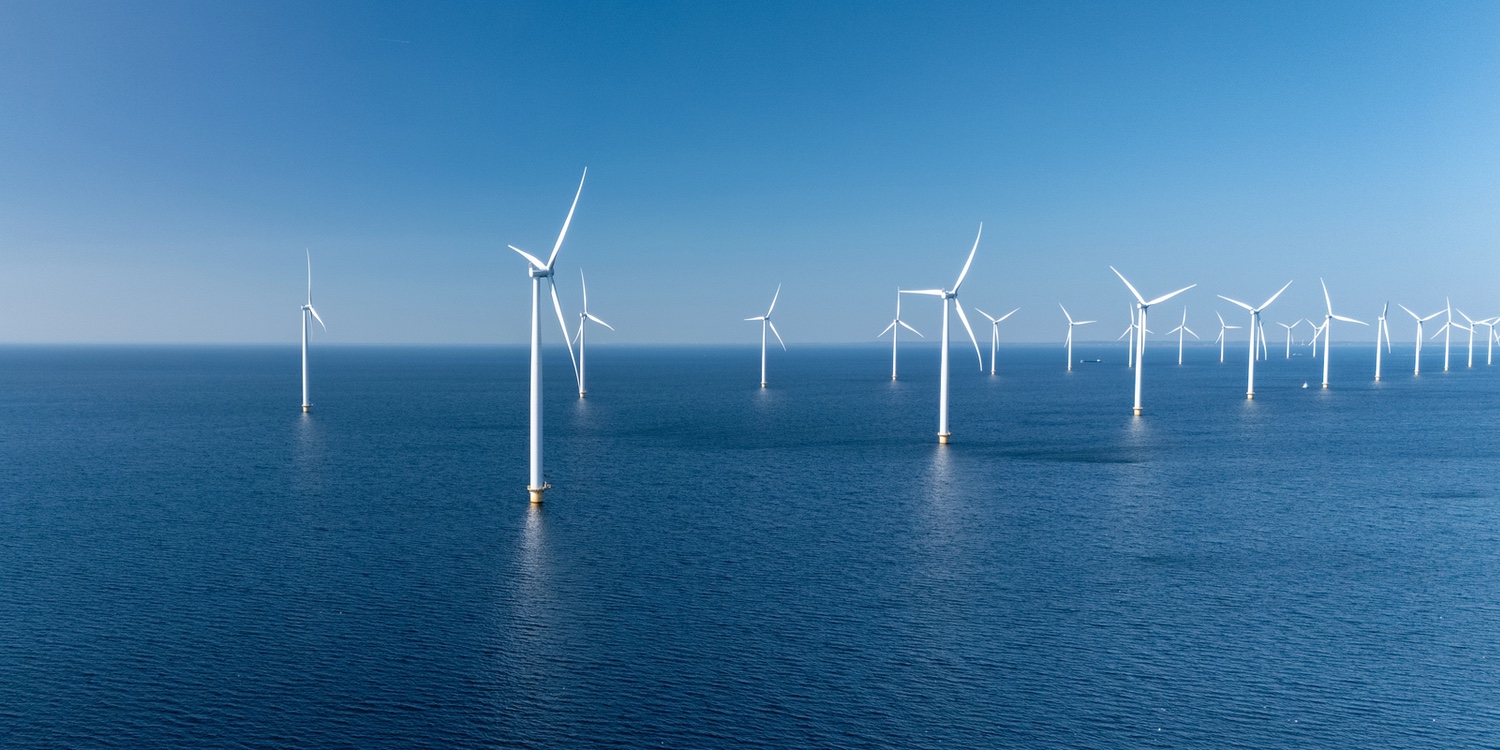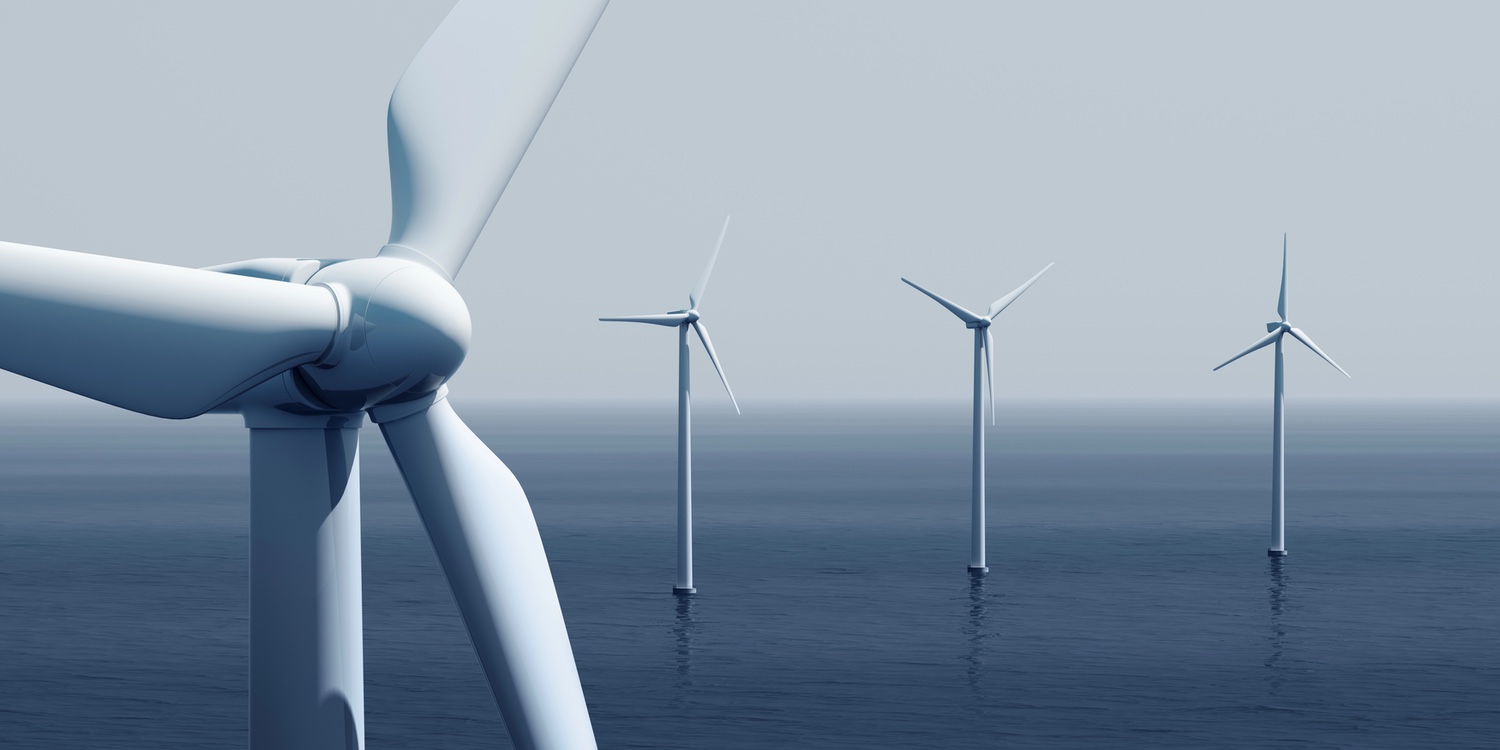
No wind turbine turns all of the wind’s energy into electricity, and physics caps that share at 59.3% of the wind’s kinetic energy, a limit the physicist Albert Betz worked out in 1920 that still holds today. Real turbines fall well short of it, and the figure that reaches your outlet is capacity factor, the share of rated power a turbine delivers over a year. The US wind fleet averaged a 33.5% capacity factor in 2023, a better guide than the Betz limit to what a wind farm delivers.
Why a turbine can’t catch all the wind
Picture blades shaped like airplane wings, angled enough that moving air pushes past instead of piling up against them. Moving air over the blades creates lift, the same effect that holds up an airplane wing, and that lift turns the blades, the Energy Information Administration explains. A drivetrain then turns that spinning motion into electricity, with its own losses along the way.
A rotor that stopped the wind completely would block the air needed to keep pushing on the blades a moment later, so some wind always has to pass through unused. That tradeoff is why Betz’s math puts a hard ceiling of 59.3% of the wind’s energy on any unshrouded turbine, and why the best rotors built today capture power at efficiencies approaching 50%, not the full theoretical limit.
Blade length is the single biggest factor in how much electricity a turbine can generate, the EIA says. The largest turbines now in operation are rated at about 15,000 kilowatts, or 15 megawatts, versus 10 kilowatts for a small residential model, the kind you might put on your own property, since both sizes run on the same physics.
Why wind speed decides more than anything else
The power available in wind rises with the cube of its speed. Double the wind speed and a turbine sees eight times the power passing through its rotor, which is why developers hunt for sites with even a few extra miles per hour of average wind. That’s also why the wind resource where you live matters more to a nearby project’s output than which brand of turbine goes up.
Air density plays a role too, since denser air pushes harder against the blades. But the wind power equation treats air density as only a linear factor, and real-world density swings are small enough that density matters far less than wind speed does.
What capacity factor measures
Capacity factor is a different number from efficiency. It measures the share of a plant’s maximum possible output that it delivers over a year, and the US wind fleet averaged a 33.5% capacity factor in 2023, according to Lawrence Berkeley National Laboratory, up from under 27% in 1999.
That fleet-wide figure blends turbines built decades apart. Wind plants built in 2022 averaged 38.2% in 2023, a newer and stronger vintage than the fleet-wide average.
Most of that gap is weather. 2023’s national wind resource index hit 0.95, the lowest level since 2005, meaning the wind blew softer than usual that year across most of the country.
Capacity factor also feeds straight into cost. LBNL put the unsubsidized cost of wind built in 2023 at $49 per megawatt-hour, the kind of number a utility has to recover before wind power ever reaches your monthly bill.
Why bigger turbines post higher numbers
Turbines have grown steadily since the late 1990s, and size explains much of why capacity factor keeps climbing. The average newly installed US turbine was rated at 3.4 megawatts in 2023, up 375% since 1998 and 1999. Its rotor spanned 133.8 meters, up 178% over the same span.
If a wind project goes up near your town, the turbine you’ll see stands taller than it would have a decade ago. Hub heights climbed too, growing 83% since 1998 and 1999 to reach 103.4 meters in 2023, because wind speeds generally increase with height above the ground. Rotor swept areas, the circles the blades trace as they spin, expanded even more, growing about 670% across those same 25 years. By 2023, 98% of newly installed turbines had rotors 115 meters wide or larger, up from virtually none in 2013.
A bigger rotor on a similarly sized generator lowers what engineers call specific power, a turbine’s rated capacity divided by the area its blades sweep, measured in watts per square meter (W/m²). US specific power fell from 393 to 237 W/m² from turbines installed in 1998 and 1999 to those installed in 2023, and the lab that tracks the fleet says a lower specific power should raise capacity factor because the same generator now catches wind across a wider circle.
Capacity factor by wind fleet vintage
| Fleet or vintage | Capacity factor | Period |
|---|---|---|
| US fleet-wide | Under 27% | 1999 |
| US fleet-wide | 36% | 2022 |
| Projects built in 2022, first full year | 38.2% | 2023 |
| US fleet-wide, a weak wind year | 33.5% | 2023 |
Source: Lawrence Berkeley National Laboratory, Land-Based Wind Market Report: 2024 Edition.
What still drags the number down
A wind project’s capacity factor falls with age, and the lab found that the median US project’s capacity factor drops to about 70% of its year-2 level by year 20.
Grid limits are another drag. When there’s more wind than transmission lines can carry, operators curtail output to avoid overloading the grid. If your utility sits inside the Southwest Power Pool grid, in the central US, that curtailment is the flip side of leaning hard on wind.
US wind curtailment averaged 4.6% across seven grid operators in 2023. Curtailment ran highest in the Southwest Power Pool, at 8.3% of its wind output that year, the same region where wind supplied 37.1% of electricity demand in 2023.
Repowering pushes back against both problems. US developers partially repowered 0.6 gigawatts of existing wind plants in 2023, mostly by fitting new rotors and nacelle components such as gearboxes and generators. The seven projects that got new rotors that year cut their average specific power from 325 to 213 W/m², the same size-driven trick that lifts capacity factor on brand-new turbines too.
Offshore turbines run higher, and bigger
Offshore wind tends to run at a higher capacity factor than onshore wind because ocean winds blow stronger and steadier, the Energy Information Administration says.
Worldwide, newly built offshore projects averaged a 41% capacity factor in 2023, against 36% for onshore, according to the International Renewable Energy Agency. Offshore’s edge has held for years, and it stood at 38% for offshore against 27% for onshore back in 2010. If you live near a US coastline where an offshore project has been proposed, that capacity factor gap is why planners expect it to outperform a similarly rated onshore turbine.
GE Vernova’s Haliade-X, rated at 12 megawatts with a rotor more than 200 meters across, is built for exactly that kind of site. The manufacturer designs it for capacity factors of about 58% to 64% at strong locations, well above either fleet average. That’s a manufacturer’s spec-sheet figure for one flagship turbine, and real projects vary by site.
Why the wind on your grid keeps climbing
Worldwide, the rotor size race keeps accelerating. Turbines with rotors wider than 180 meters accounted for 58.6% of the 2024 global market, up from 42.9% the year before, the Global Wind Energy Council reports. The average new turbine installed anywhere in the world was rated at 5,500 kilowatts in 2024, a 9% increase from 2023.
That same lever, a lower specific power that lets one generator sweep a wider circle of wind, is why the US fleet’s capacity factor kept climbing even through a weak wind year nationwide. Repowering existing rotors with wider blades raises capacity factor even on machines already built, which is part of why wind’s share can keep growing without a wave of new turbines going up.
If wind already shows up in your electricity mix, that’s part of why its share keeps growing. Wind now supplies about 10% of US electricity generation, a share that grows every time a rotor gets wider or a new turbine goes up.