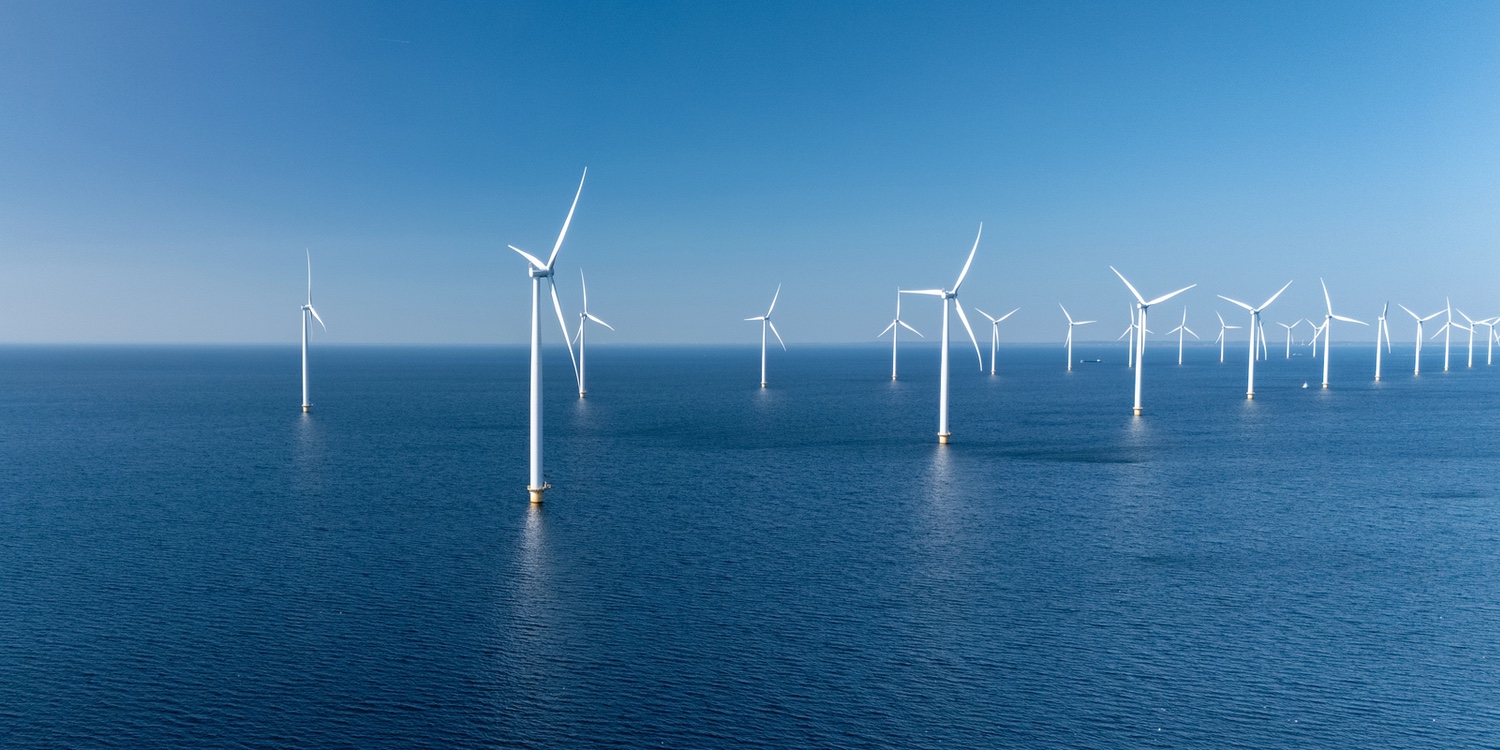
The average new wind turbine installed in the US in 2025 has a 141-meter rotor and a rating of 3.76 megawatts. Dongfang Electric says its 26-megawatt test turbine in China is the largest in the world, and it stands at a test base on land. The figures below come from Lawrence Berkeley National Laboratory, the US Department of Energy, IRENA and the wind trade press, and they describe 2025 unless a line says otherwise.
Top wind turbine statistics
- Dongfang Electric’s 26-megawatt test turbine, installed in 2025, has a 310-meter rotor and 153-meter blades, according to the company.
- The largest turbine running at sea is a 20-megawatt machine that China Three Gorges commissioned in early 2026.
- New turbines worldwide averaged almost 5.5 megawatts in 2024, up 9% from 2023.
- The average new offshore turbine worldwide reached 10.3 megawatts in 2025, the first year that average passed 10 megawatts.
- In Europe, the average new onshore turbine rose from 4.6 to 5.2 megawatts between 2024 and 2025.
- Revolution Wind, off Rhode Island and Connecticut, finished installing all 65 of its 11-megawatt turbines in September 2026.
- The US wind fleet averaged a 33.5% capacity factor in 2023, and projects built in 2022 reached 38.2%.
- Onshore wind power cost a global average of $33 per megawatt-hour in 2025, down 71% since 2010.
- A small turbine that can power one home has a capacity of about 10 kilowatts, according to the US Energy Information Administration.
How big is a new US wind turbine?
The average new US turbine had a 136.7-meter rotor and a 106-meter hub in 2024, and rotor diameter has grown in every period since 1998. The table gives the yearly averages for new land-based turbines.
| Year installed | Average rating (MW) | Rotor diameter (m) | Hub height (m) |
|---|---|---|---|
| 1998 and 1999 | 0.716 | 48.2 | 56.6 |
| 2000 and 2001 | 0.888 | 52.9 | 58.2 |
| 2002 and 2003 | 1.234 | 63.6 | 66.2 |
| 2004 and 2005 | 1.456 | 73.6 | 74.1 |
| 2006 | 1.612 | 77.9 | 76.0 |
| 2007 | 1.646 | 79.0 | 78.2 |
| 2008 | 1.667 | 79.3 | 78.5 |
| 2009 | 1.742 | 81.5 | 78.8 |
| 2010 | 1.791 | 84.1 | 79.7 |
| 2011 | 1.966 | 89.0 | 81.0 |
| 2012 | 1.944 | 93.4 | 83.9 |
| 2013 | 1.865 | 96.9 | 80.5 |
| 2014 | 1.937 | 99.5 | 82.7 |
| 2015 | 2.003 | 102.4 | 82.4 |
| 2016 | 2.141 | 108.2 | 83.0 |
| 2017 | 2.320 | 113.0 | 86.0 |
| 2018 | 2.430 | 115.6 | 88.1 |
| 2019 | 2.551 | 121.2 | 90.1 |
| 2020 | 2.762 | 124.9 | 90.1 |
| 2021 | 2.994 | 127.4 | 93.9 |
| 2022 | 3.226 | 131.6 | 98.1 |
| 2023 | 3.400 | 133.8 | 102.0 |
| 2024 | 3.495 | 136.7 | 106.0 |
| 2025 (partial) | 3.764 | 141.0 | 101.8 |
Source: Lawrence Berkeley National Laboratory, Land-Based Wind Energy Technology Data Update, 2026 edition. The 2025 row is partial: rating and rotor are known for 94% of installed projects and hub height for 75%, so it shouldn’t be compared with 2024.
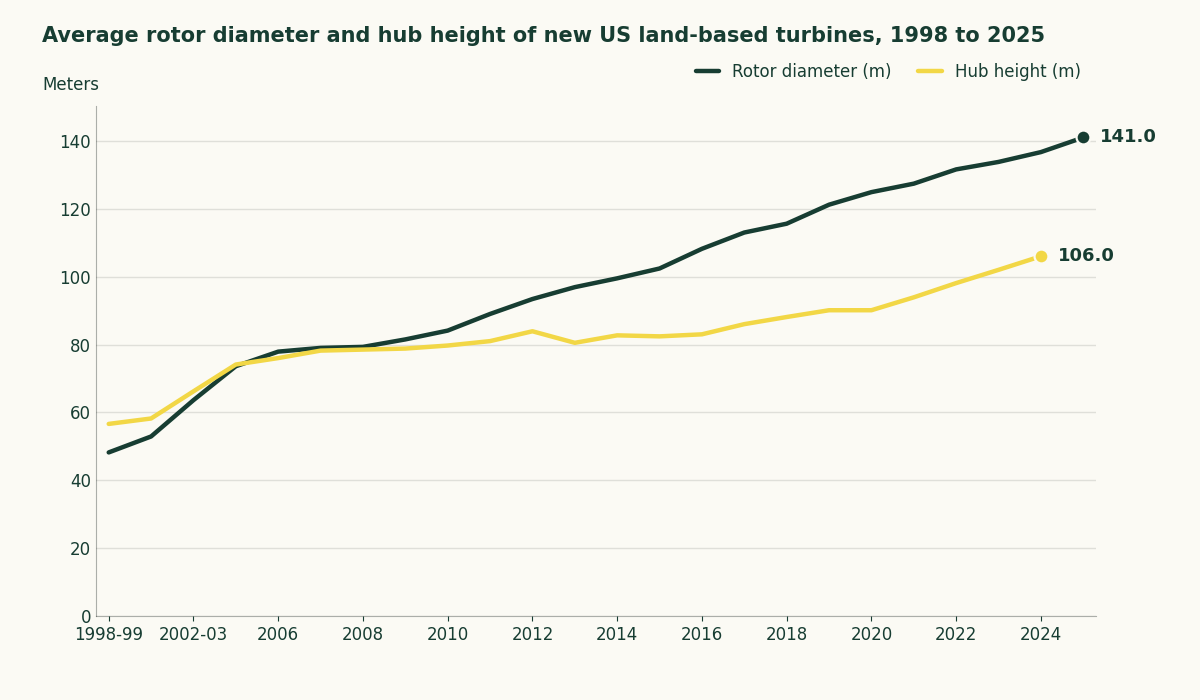
Rotors kept growing. In 2024, 54.6% of new turbines had rotors of 130 meters or more, up from none in 2017.
What are the biggest wind turbines in the world?
The biggest turbine reported running in 2026 is Dongfang Electric’s 26-megawatt unit, which Dongfang says began sending power to the grid at a test base in Dongying, China, on October 29, 2025. It’s an offshore-class model on a land test site, and the rating is the company’s figure. Dongfang first rolled out the nacelle in October 2024, before any turbine stood.
| Turbine | Maker | Rated power (MW) | Rotor (m) | Site | Status |
|---|---|---|---|---|---|
| DEW-26 | Dongfang Electric | 26 | 310 | Land test base | Running, test unit |
| SG 21-276 DD | Siemens Gamesa | 21.5 | 276 | Land test center | Prototype |
| CTG-Goldwind 20 MW | China Three Gorges, Goldwind | 20 | 300 | Offshore | Running at sea |
| MySE18.X-20MW | Mingyang | 20 | 260 to 292 | Land test site | Test unit, blades broke |
| H260-18MW | CSSC Haizhuang | 18 | 260 | Not stated | Unveiled 2023 |
| GWH252-16MW | Goldwind | 16 | 252 | Offshore | Installed at sea |
| V236-15.0 MW | Vestas | 15 | 236 | Offshore | Commercial |
| SI-270150 | Sany | 15 | 270 | Onshore | Installed |
| Twin-rotor floating | Mingyang | 50 (two 25 MW rotors) | 290 each | Floating offshore | Announced |
Source: offshoreWIND.biz on Dongfang, SASAC, POWER on Siemens Gamesa, offshoreWIND.biz on China Three Gorges, offshoreWIND.biz on Mingyang and New Atlas, POWER on CSSC Haizhuang, offshoreWIND.biz on the first offshore 16 MW turbine, Vestas, POWER on Sany, offshoreWIND.biz annual overview. Status as of September 2026.
Siemens Gamesa’s prototype and Dongfang’s unit stand on land test sites, and Mingyang’s test unit lost two blades in December 2024. CSSC Haizhuang unveiled its 18-megawatt design in January 2023.
Are offshore turbines bigger than onshore ones?
Yes. Europe’s new offshore turbines averaged 10.7 megawatts in 2025, against 5.2 onshore, roughly twice the size. The table lines up each average with the region and the year it covers.
| Year | Scope | Turbine type | Average rating (MW) |
|---|---|---|---|
| 2022 | Global | Offshore | 7.7 |
| 2023 | Global | Offshore | 9.7 |
| 2024 | Global | Offshore | 9.815 |
| 2024 | Global | Onshore | Over 5 |
| 2025 | Global | Offshore | 10.3 |
| 2025 | Europe | Onshore | 5.2 |
| 2025 | Europe | Offshore | 10.7 |
| 2025 | Global | All types | 6.3 |
Source: US Department of Energy and NREL, Offshore Wind Market Report, 2024 edition, GWEC, 2024 supply-side data, GWEC, Global Offshore Wind Report 2026, WindEurope, 2025 statistics, GWEC, 2025 supply-side data. The DOE figures cover installations worldwide, and the 2025 all-types figure is GWEC’s installed capacity divided by its turbine count.
The 9.7-megawatt average for 2023 comes from the DOE and NREL offshore report and covers installations worldwide. WindEurope counts turbines that began sending power in Europe, while GWEC counts turbines installed worldwide, so the two averages aren’t directly comparable.
GWEC counted 28,395 new turbines and 178 gigawatts installed in 2025, which works out to about 6.3 megawatts per turbine.
Turbines going into US offshore projects are smaller than the Chinese models listed above, as the next table shows.
| Project | Turbine | Rating (MW) | Turbines |
|---|---|---|---|
| Vineyard Wind 1 | GE Haliade-X | 13 | 62 |
| Revolution Wind | Siemens Gamesa SG 11.0-200 DD | 11 | 65 |
| Coastal Virginia Offshore Wind | Siemens Gamesa | 14 | 176 |
| Empire Wind 1 | Vestas V236-15.0 MW | 15 | 54 |
Source: Vineyard Wind, offshoreWIND.biz on Revolution Wind, offshoreWIND.biz on Coastal Virginia Offshore Wind, Empire Wind.
If you live on the coast between Massachusetts and Virginia, these are the machines going into the water off your shore. Coastal Virginia’s first turbine went up in January 2026, and the project was 81% complete on July 31, 2026.
How long can wind turbine blades get?
The longest blade reported is 153 meters long, on Dongfang’s 26-megawatt test unit.
| Blade length (m) | Turbine | Type | Year |
|---|---|---|---|
| 153 | Dongfang 26 MW | Land test unit | 2025 |
| 147 | China Three Gorges and Goldwind 20 MW | Offshore | 2026 |
| 131 | Sany 15 MW | Onshore | 2024 |
| 115.5 | Vestas V236-15.0 MW | Offshore | Introduced 2021 |
| 107 | GE Haliade-X 12 MW | Offshore prototype | 2019 |
Source: offshoreWIND.biz annual overview, offshoreWIND.biz on China Three Gorges, POWER on Sany, Vestas, Port of Rotterdam.
Why do bigger rotors pay off?
Bigger rotors pay off because they catch more wind for each kilowatt of generator, and Lawrence Berkeley National Laboratory says a lower rating per rotor area should raise capacity factor. That’s the share of its maximum output a turbine delivers over a year. A longer blade sweeps a wider circle of air, so the same generator sees more wind.
Engineers call that rating per rotor area specific power. It fell from 393 to 237 watts per square meter on new US turbines installed from 1998 and 1999 through 2023.
If a wind farm has gone up near you since 2023, its turbines most likely have big rotors, since DOE found that 98% of new turbines in 2023 had rotors 115 meters or wider. The page on wind turbine efficiency covers what that does to a turbine’s output.
How much does wind power cost?
Bigger turbines lower the cost of a wind farm because fewer turbines are needed to generate the same energy, DOE says.
IRENA reports 2025 costs of $33 per megawatt-hour for onshore wind and $78 for offshore, and says cheaper equipment and installed costs were offset by a higher cost of capital and slightly lower capacity factors. IRENA doesn’t separate out the effect of turbine size.
| Wind power cost, 2025 | Cost ($ per MWh, 2025 dollars) |
|---|---|
| Global onshore | 33 |
| Global offshore | 78 |
| China onshore | 27 |
| China offshore | 49 |
| US offshore | 141 |
Source: IRENA, Renewable Power Generation Costs in 2025, executive summary.
How did wind turbines get from 12 kilowatts to 26 megawatts?
Charles Brush built a 12-kilowatt wind turbine in Cleveland in the 1880s, and Case Western Reserve University dates it to 1888. The table follows the story from there to Dongfang’s test unit.
| Year | Turbine | Rated power (kW) |
|---|---|---|
| 1888 | Brush turbine, Cleveland | 12 |
| 1941 | Smith-Putnam, Vermont | 1,250 |
| 1957 to 1967 | Gedser, Denmark | 200 |
| 1975 | NASA Mod-0, Ohio | 100 |
| 1987 to 1996 | Boeing Mod-5B, Hawaii | 3,200 |
| 2004 | REpower 5M prototype, Germany | 5,000 |
| 2019 | GE Haliade-X prototype, Rotterdam | 12,000 |
| 2023 | Goldwind GWH252-16MW, offshore China | 16,000 |
| 2025 | Dongfang DEW-26, land test base | 26,000 |
Source: US Department of Energy, Case Western Reserve University, IEEE Engineering and Technology History Wiki, NASA, OSTI, Renewable Energy World, offshoreWIND.biz on the Haliade-X, offshoreWIND.biz on the first offshore 16 MW turbine, SASAC.
The Smith-Putnam turbine ran for 1,100 hours before a blade failed. Sources disagree on its size, since IEEE’s history wiki titles its page on the machine 1.5 megawatts and the table uses DOE’s 1,250 kilowatts. NASA switched on Mod-0 on October 29, 1975.
Why can’t onshore turbines just keep growing?
Roads set the limit. NREL’s 2014 transportation study found US roads generally cap a single-piece blade at 53 to 62 meters, and DOE says blades can’t be folded or bent once they’re built. Tower sections are generally limited to 4.3 meters wide, so they fit under overpasses.
If you’ve been stuck behind a truck hauling one blade around a highway curve, that’s the limit at work. By rail, NREL puts the ceiling for a single-piece blade at 75 meters.
Those limits describe US roads and rails, and they don’t bind everywhere. Sany installed a 15-megawatt onshore turbine with a 131-meter blade in Jilin, China, in October 2024.
How big are home wind turbines?
A small turbine that can power one home has a capacity of about 10 kilowatts, and DOE defines small turbines as anything from 20 watts to 100 kilowatts.
| Small wind in the US, 2024 | Value |
|---|---|
| Turbines sold | 160 |
| Capacity installed (MW) | 2.0 |
| Investment ($ million) | 13.5 |
| Average installed cost ($ per kW) | 6,680 |
| Average capacity factor, small turbines (%) | 16 |
Source: Pacific Northwest National Laboratory, Distributed Wind Energy Technology Data Update, 2025 edition.
If you’re pricing a home turbine, $6,680 per kilowatt means a home-size system would cost about $66,800 installed, and that average rests on a small sample. Small turbines in PNNL’s 2024 sample ran at a 16% capacity factor, well below the 24% for midsize and large ones.
Where these numbers come from
Two figures are computed from the sources above. The 2025 world average turbine size is GWEC’s installed capacity divided by its turbine count, and the installed cost of a home-size system is PNNL’s cost per kilowatt scaled up to a home-size unit. The 2025 US figures are partial, so hub height isn’t compared between 2024 and 2025 and the chart leaves that point blank. GWEC counts turbines installed and WindEurope counts turbines that began sending power, so their averages differ by design.
Where Coastal Virginia and Empire Wind stand
The last of Coastal Virginia’s 176 turbines is expected to go up by the end of 2027. Empire Wind 1’s plan calls for 54 Vestas turbines rated at 15 megawatts each, for New York.
For what these projects cost and where they stand, see the page on offshore wind power. For how much wind the US has built so far, see wind power in the US.