Originally published December 10, 2010. Updated September 28, 2026.
US oil and gas operations leak at least 13 million metric tons of methane a year, according to a five-year measurement series led by the Environmental Defense Fund. That’s 60% more than the EPA’s own estimate of 8 million tons. The bigger that gap, the weaker the argument that the gas heating your house or running your local power plant burns cleaner than coal. The EPA keeps one count, IEA and Carbon Mapper keep their own with different tools, and Washington keeps rewriting what producers owe for what leaks.
How much methane escapes from US oil and gas
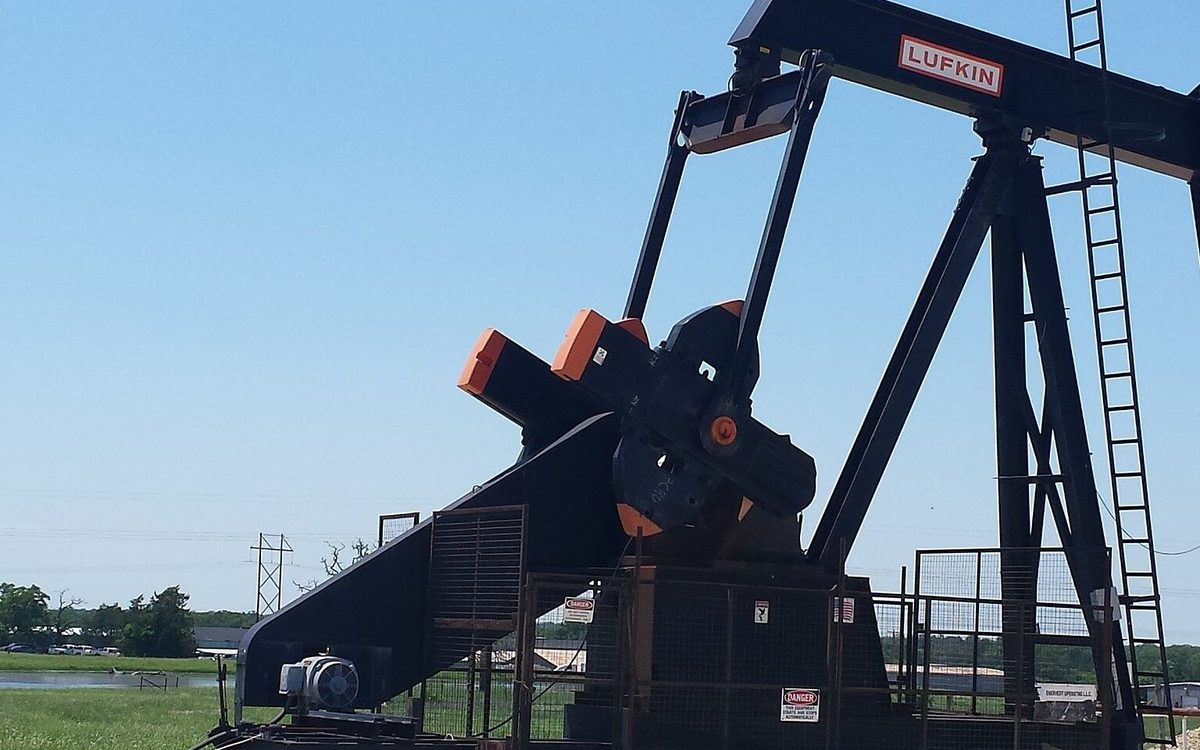
The wells and pipelines built during the 2010s shale gas expansion are the infrastructure this whole question is about. A leak from a corroded valve or a loose pipe joint is invisible and mostly odorless. A leak like that shows up mainly on an infrared camera aimed at the equipment, the same kind of imaging behind EDF’s own aircraft measurements and Carbon Mapper’s satellites, described below. If a well pad or compressor station sits near your town, this is the kind of leak nobody standing next to it can see or smell.
The EPA keeps its own official count in the Greenhouse Gas Inventory. Its most recently finished edition covers data through 2022 and was published in April 2024, and a newer draft covering data through 2023 was already out for public comment as of the same reading. The government’s own number keeps moving as more data comes in.
Industry and environmental groups often talk past each other here because leak rate isn’t one fixed number. It’s conventionally measured against gross gas production, everything pulled out of the ground, a much bigger figure than what reaches a customer’s meter. That’s also why a leak rate quoted to reassure a customer like you can look a lot smaller than the one an aircraft or satellite finds upstream.
Atmospheric methane keeps climbing worldwide, not from oil and gas alone. NOAA’s monitoring network measured a global average of 1,939 parts per billion in May 2026, up from 1,933 parts per billion a year earlier.
The satellites and instruments trying to check that number
The International Energy Agency published its latest worldwide count, the Global Methane Tracker 2025, on May 7, 2025. Separate from any government inventory, a nonprofit called Carbon Mapper flies its own Tanager satellites and says its public tracker has logged more than 36,000 methane plumes worldwide, plus close to 7,800 carbon dioxide plumes in total. It works alongside the United Nations Environment Programme’s International Methane Emissions Observatory, which targets the same leaks on the ground.
Tools like these are what would catch a leak near your neighborhood long before a multi-year federal inventory counted it.
A dedicated methane-hunting satellite called MethaneSAT, built by the Environmental Defense Fund, launched in March 2024. It lost contact with ground control on June 20, 2025, and its operators said the satellite was likely not recoverable the following month. Satellite monitoring of individual leaks now runs mostly through the projects still flying, Carbon Mapper included.
Why a 20-year leak looks worse than a 100-year one
The IPCC’s Sixth Assessment Report, published in 2021, measured methane’s warming power against carbon dioxide’s over two different time frames.
Over 20 years, a ton of fossil methane, the kind that comes from wells and pipelines, traps about 83 times as much heat as a ton of carbon dioxide. Over 100 years, the same ton of fossil methane traps about 30 times as much.
Non-fossil methane, the kind that doesn’t come from drilling, traps less heat on both counts. Over 20 years it traps about 80 times as much as carbon dioxide. Over 100 years that falls to about 27 times as much, the same IPCC dataset shows.
| Time horizon | Fossil methane vs. CO2 | Non-fossil methane vs. CO2 |
|---|---|---|
| 20 years | about 83 times | about 80 times |
| 100 years | about 30 times | about 27 times |
Source: IPCC Sixth Assessment Report, Chapter 7 (2021).
Which time frame you pick decides which fuel looks cleaner for the exact same leak. Judge a leak at a well near you on the 20-year number and gas barely beats coal, but judge that same leak on the 100-year number instead and gas looks a lot cleaner. The physics doesn’t change. Only the clock does.
Does gas still beat coal on climate
If you’ve heard natural gas pitched to you as a bridge away from coal, the math above is what that pitch rests on. On the 100-year clock, a leak costs less, and gas keeps its case as the cleaner fuel. On the 20-year clock, the same leak costs close to three times as much, and the bridge gets a lot shakier.
It’s also the case behind the decline of coal as a power source, one that leans on gas burning cleaner. The US has more riding on that answer than most countries, given how much of its power and how many of its jobs still run on oil and gas. Nobody in this fight, the EPA included, agrees on the exact number, and that argument goes back years. A 2011 investigation found EPA’s own leak estimates at the time were data the agency itself had called flawed.
What Washington’s methane rules require now
Federal policy on methane from oil and gas has swung twice in about a year. The EPA finalized a fee on excess emissions, the Waste Emissions Charge required under the Inflation Reduction Act, on November 12, 2024. That fee would have applied to leaks like the ones in the gas reaching your stove or furnace. Congress repealed it under the Congressional Review Act within four months, and President Trump signed that repeal on March 14, 2025.
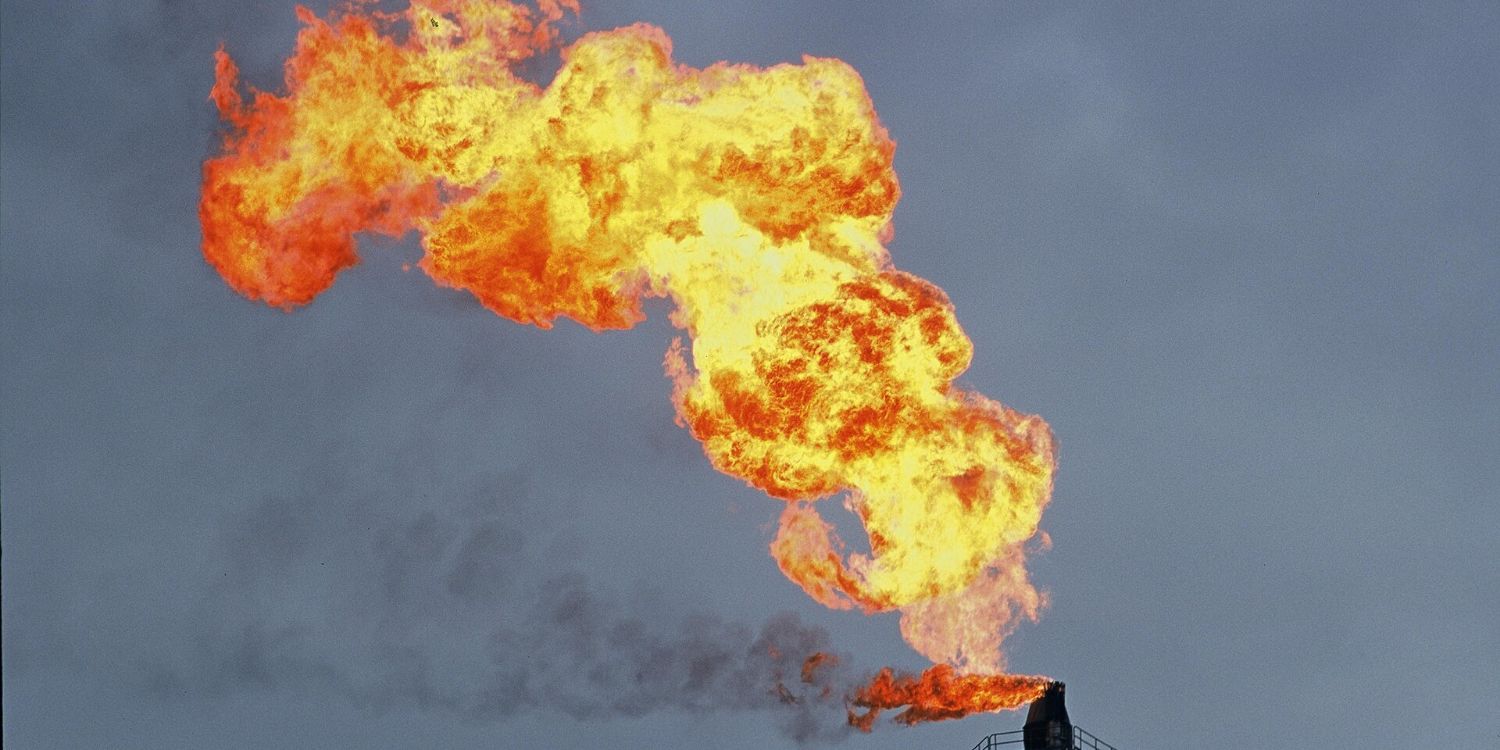
The agency’s separate emissions standards for oil and gas equipment, known as OOOOb and OOOOc, went through a reversal of their own. The EPA announced it would reconsider the Biden-era rule on March 12, 2025, then finalized narrower technical changes to two parts of it on April 4, 2026. A separate deadline meant to phase out routine flaring at new wells was set for May 7, 2026, but the EPA clarified on May 1, 2026 that flaring is still allowed in limited circumstances.
Read together, the fee that would have made leaking expensive is gone, and the equipment rule survived in a narrower form than regulators originally finalized. Producers now carry less federal cost for their own methane, and the standard that is supposed to control it is still being rewritten.
What’s left to check this number now that MethaneSAT is gone
MethaneSAT, the satellite EDF built to check the leak number independently, has been gone since the summer of 2025. The main satellite project still flying is Carbon Mapper, whose Tanager satellites have logged more than 36,000 methane plumes worldwide alongside the United Nations Environment Programme’s International Methane Emissions Observatory.
On the regulatory side, the EPA’s broader reconsideration of the equipment rule still hasn’t finished working through the federal rulemaking process, so even the government’s own standard keeps moving under it. Nobody working on this number, in government or out, has closed the gap between 8 million tons and 13 million tons. For now, EDF’s aircraft and whatever satellites are still flying, Carbon Mapper included, are the only real check on that gap.