Originally published February 3, 2014. Updated September 28, 2026.
China gets about 18% of its electricity from wind and solar combined, up from roughly 4% in 2015, and in 2025 its coal-fired power output fell for the first time since 2015, even as demand kept climbing. Combined wind and solar capacity topped coal’s installed capacity for the first time in the first half of 2025.
The scale today
Wind and solar capacity in China reached 1,408 gigawatts by the end of 2024, up from 635 gigawatts two years earlier. Output is catching up too. Wind and solar generated 2,073 terawatt-hours in the twelve months through June 2025, more than hydro and nuclear power produced together, plus what bioenergy added on top, a combined 1,936 terawatt-hours over that same stretch.
Coal, still the biggest source, now shrinking
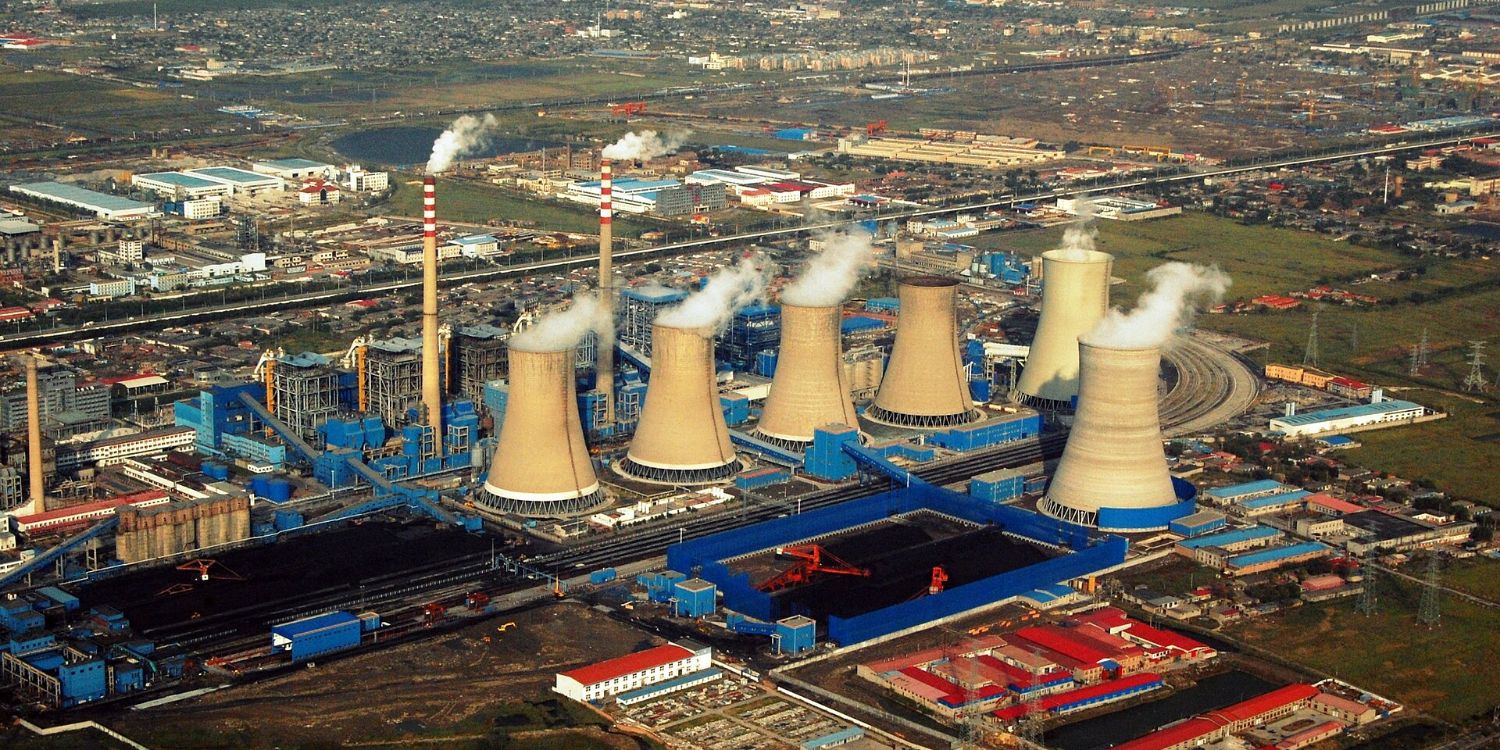
Coal still supplies more of China’s power than any other fuel. In 2015, coal-fired plants supplied more than 72% of the country’s generation. If part of your own electricity comes from a coal plant, you’re using the same fuel that supplied more than 72% of China’s power back in 2015, before wind and solar started cutting into its share. An exact current coal percentage is harder to pin down, since some tallies group it with gas and oil, so the clearest read is the trend, not one static number.
Coal generation fell by about 90 terawatt-hours in 2025, a drop of roughly 1.6%, even as electricity demand grew about 5% for the year. Ember counted a decline of 71 terawatt-hours, the first annual drop in China’s coal generation since 2015.
Solar kept climbing over that same year. Generation reached 336 terawatt-hours in 2025, up 40% from the year before. For more on the pattern behind coal’s drop, see how US coal power has declined.
Electrification is also crowding out fossil generation from the demand side. Electric kilns replaced 34 terawatt-hours of coal-fired industrial heat in 2023, and electric vehicles displaced 22 terawatt-hours of oil demand that same year. Thermal generation overall fell 2% in the first half of 2025, compared with the first half of 2024, even as industrial production grew 6.4% over that stretch.
Coal keeps getting built, even as its share falls
A shrinking share doesn’t mean China stopped building coal plants. New and reactivated coal project proposals surged to 161 gigawatts in 2025, a record high. China also brought 78 gigawatts of coal power online in 2025, the most in a decade, and had 291 gigawatts of coal capacity in its pipeline by the end of the year, already permitted or under construction.
If you or your town depends on coal jobs, this is the same tension at a bigger scale. China brought 78 gigawatts of coal capacity online in 2025, the same year its coal generation declined for the first time in a decade.
The same year, the country deployed roughly 74 gigawatts of energy storage, nearly matching the coal capacity it commissioned. Global Energy Monitor’s report warns that permitting at this pace risks overcapacity and stranded coal assets even as renewables keep cutting into coal’s own generation share.
The wind and solar build-out
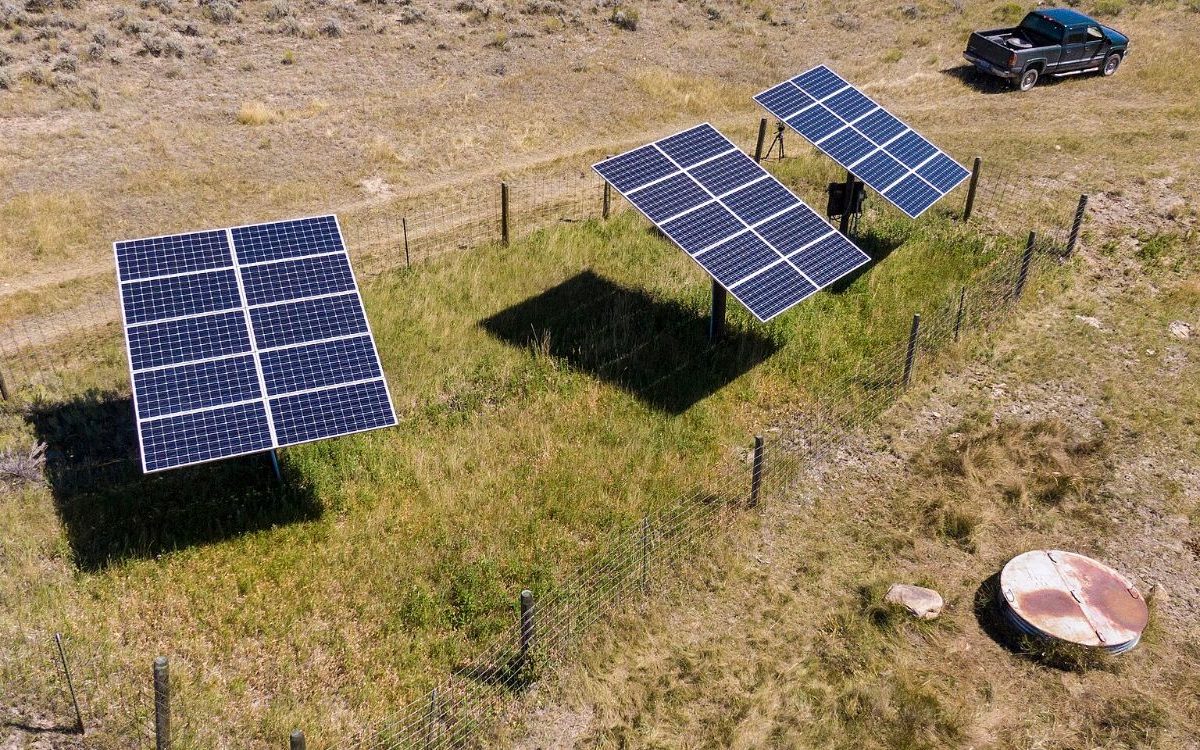
China built its way to its current scale fast. In the first half of 2025, it added 213 gigawatts of new solar capacity, more than the entire United States has installed in total, plus 52 gigawatts of new wind capacity. Combined wind and solar output grew 27% year over year over that same stretch.
The national 18% average hides big differences by province. Qinghai got 46% of its electricity from wind and solar in 2024, more than the EU’s 29% share that year. Your grid, if you’re in the EU, drew less from wind and solar in 2024 than either of the next two provinces manage on their own. Gansu reached 36% and Jilin reached 33%, both in 2024.
Clean power is absorbing almost all of the country’s new electricity demand too. In 2024, wind, solar, hydro and nuclear together supplied 84% of the growth in China’s electricity demand, compared with 16% of demand growth between 1991 and 2000.
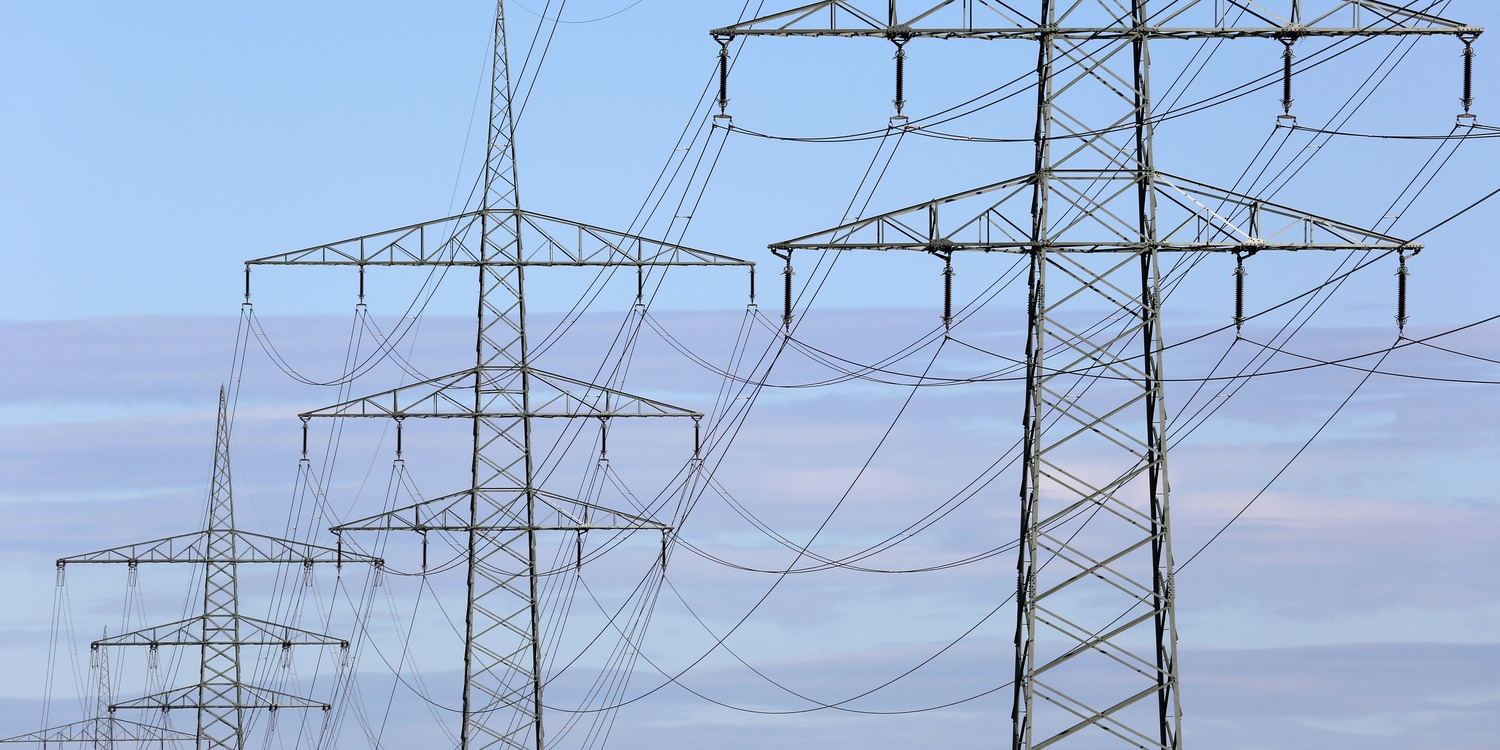
Battery storage is scaling up alongside the panels and turbines. China commissioned 37 gigawatts of battery storage in 2024, more than the US and Europe added combined that year, and total battery capacity reached 95 gigawatts by mid-2025. Grid investment grew alongside it. Chinese grid companies invested 600 billion yuan, about $85 billion, in 2024, up from 485 billion yuan in 2019.
Curtailment and the grid lag
Curtailment is power a wind or solar farm could generate that the grid doesn’t take. Picture a solar farm on a clear afternoon with rows of panels deliberately powered down, or a wind farm pitching its blades to spill the wind instead of catching it, because there’s nowhere on the grid to send the extra electricity.
In the first half of 2025, China’s solar curtailment rate rose to 5.7%, up from 3.0% a year earlier. Wind curtailment rose to 6.6%, up from 3.9% over the same stretch, based on National Energy Administration data reported by Bloomberg. If you’ve read about a solar or wind project waiting years for a grid connection near you, this is the same bottleneck showing up at a much bigger scale.
Curtailment cuts directly into a plant’s capacity factor, the share of its maximum possible output it delivers. China’s grid still can’t always absorb wind and solar power the moment it’s built, which is part of why transmission and grid flexibility haven’t kept pace with the buildout.
How China’s mix compares to the US
Side by side, the two grids run on different fuels. If you’re on the US grid, natural gas likely supplies more of your power than any other single fuel. It supplied 43.1% of US generation in 2023, with coal at 16.2% and nuclear at 18.6%.
Renewables supplied 21.4% of US generation that year, with wind alone accounting for 10.2% of the total. Hydro added 5.7%, and solar added 3.9%.
China runs a different setup. Wind and solar alone supplied 18% of China’s generation in 2024, already close to the US total for wind, hydro and solar combined. Your counterpart on China’s grid is still more likely getting their power from coal than from any other single fuel.
The two countries pull these figures from different years and reporting systems, so treat this as a general comparison. To see how mix differences show up in cost, electricity prices around the world is worth a look.
Coal’s first annual drop doesn’t settle the trend
China’s coal-fired generation fell for the first time since 2015, and in the same year the country brought 78 gigawatts of coal power online, the most in a decade, and approved a record 161 gigawatts of new coal projects.
Whether that decline continues or turns out to be a one-year dip inside a still-growing coal fleet depends on how many of the 291 gigawatts already permitted or under construction get built and run. Nobody publishes that answer in advance. The plainest fact is the one already on the books. Coal generation dropped and coal construction hit a decade high in the same twelve months.