Uranium is a dense, weakly radioactive metal, element 92 on the periodic table, and only 0.7% of natural uranium is U-235, the isotope that keeps a reactor’s chain reaction going. Nuclear plants supply about 20% of US electricity, and 7% of the uranium delivered to US reactors in 2025 was mined in the United States. Most of the numbers here come from the US Energy Information Administration (EIA), the Department of Energy (DOE) and the World Nuclear Association (WNA), and each carries its own period.
Top uranium statistics
- Natural uranium is 99.27% U-238 and 0.711% U-235, according to DOE.
- Enrichment raises the U-235 share to 3% to 5% for most of the world’s reactors.
- Kazatomprom, the world’s largest producer, mined 25.8 thousand tonnes of uranium (tU) in 2025, about 20% of global primary output by its own estimate.
- Canada was the top source for US reactors in 2025, supplying 32% of deliveries, with Kazakhstan close behind at 28%.
- US mills and in-situ plants produced 2.1 million pounds of U3O8 in 2025, up from 657,000 pounds in 2024.
- The NRC says DOE stores more than 700,000 metric tons of depleted uranium hexafluoride, the leftover from enrichment.
- Cameco’s month-end spot price peaked at $136 per pound of U3O8 in June 2007 and was $91.55 on October 30, 2026.
- The OECD Nuclear Energy Agency counted 7,934,500 tU of identified recoverable resources as of January 1, 2023.
What is uranium used for?
Uranium is used mostly as reactor fuel, and nuclear plants make about 9% of the world’s electricity, over 2,500 TWh a year, according to WNA. Roughly one in five kilowatt-hours on a US power bill comes from that fuel, which sits inside the US fleet of nuclear power plants.
The same reactors also supply district heating and seawater desalination, USGS says. How much more uranium reactors will want depends on the outlook for nuclear power.
What are the isotopes of uranium?
U-238 carries three more neutrons than U-235, and that small weight difference is what enrichment plants exploit.
The lighter isotope is the one reactors burn. When its nucleus splits, it produces both heat and extra neutrons, and under controlled conditions those neutrons split neighboring atoms. Uranium itself is everywhere, since EPA says it’s present in virtually all soil, rock and water, which includes the dirt in your yard.
Grades are named by how far the uranium has been enriched.
| Material | U-235 share (%) | Where it’s used |
|---|---|---|
| Depleted uranium | 0.711 or less | Counterweights, shielding |
| Natural uranium | 0.711 | Feed for enrichment |
| Low enriched uranium (LEU) | 0.711 to 20 | Power reactors |
| Typical reactor fuel | 3 to 5 | Light-water reactors |
| High-assay low-enriched uranium (HALEU) | 5 to under 20 | Advanced reactors |
| Highly enriched uranium (HEU) | Above 20 | Naval reactors, weapons, some research reactors |
Source: DOE, Nuclear Fuel Facts: Uranium, DOE, What is HALEU.
How is uranium enriched?
Commercial enrichment lifts U-235 to 3% to 5%, the grade most reactors burn. Mined uranium is converted into uranium hexafluoride gas before it goes in, because the gas works at a suitable temperature for the machines.
Making one kilogram of 5% fuel takes 7.9 separative work units (SWU) at a 0.25% tails assay, and SWU is the unit enrichers use to measure their work.
| Operator | 2022 capacity (thousand SWU a year) | 2025 capacity (thousand SWU a year) |
|---|---|---|
| Rosatom | 27,100 | 29,133 |
| Urenco | 17,300 | 17,300 |
| CNNC (estimate) | 10,613 | 13,789 |
| Orano | 7,500 | 7,500 |
| Other | 128 | 355 |
| World total | 62,641 | 68,076 |
Source: World Nuclear Association, Uranium Enrichment. CNNC’s figures are the association’s estimate.
US reactor owners bought 13 million SWU in 2025 at $108.70 each, and 77% of that work came from foreign plants. Centrus says its Piketon, Ohio, plant is the only US facility licensed by the NRC to produce HALEU.
What is depleted uranium?
Depleted uranium is the leftover from enrichment. The NRC gives the arithmetic: 85 kg of enriched fuel and 915 kg of depleted uranium from every 1,000 kg of natural uranium.
Most of it sits in storage. Depleted uranium is mostly kept as hexafluoride in 14-ton cylinders near enrichment plants. DOE’s Portsmouth site in Ohio and Paducah site in Kentucky hold more than 67,000 cylinders of it.
Depleted uranium is 1.7 times as dense as lead, which is why it ends up in counterweights, shielding and military penetrators.
Where is uranium mined?
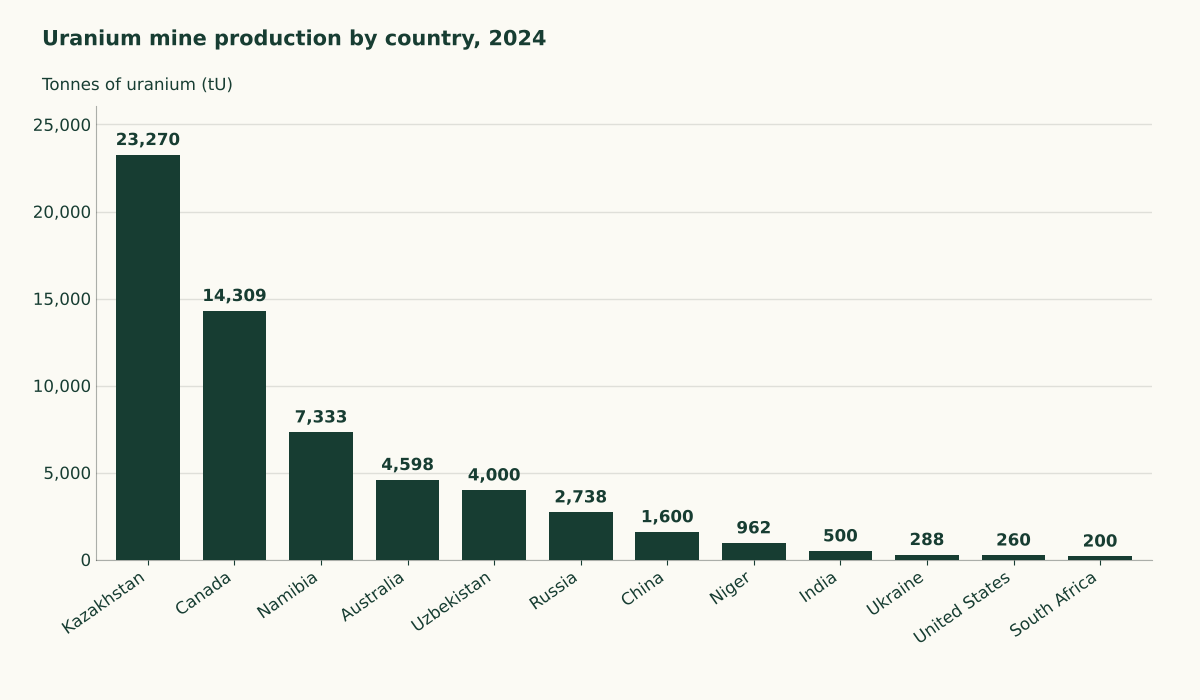
World mining output reached 60,213 tU in 2024, up from 47,731 tU in 2020.
| Country | 2020 (tU) | 2024 (tU) | 2024 share of world (%) |
|---|---|---|---|
| Kazakhstan | 19,477 | 23,270 | 38.6 |
| Canada | 3,885 | 14,309 | 23.8 |
| Namibia | 5,413 | 7,333 | 12.2 |
| Australia | 6,203 | 4,598 | 7.6 |
| Uzbekistan (estimate) | 3,500 | 4,000 | 6.6 |
| Russia | 2,846 | 2,738 | 4.5 |
| China (estimate) | 1,885 | 1,600 | 2.7 |
| Niger | 2,991 | 962 | 1.6 |
| United States | 6 | 260 | 0.4 |
| World total | 47,731 | 60,213 | 100 |
Source: WNA, World Uranium Mining Production. Shares are calculated from the association’s tonnes.
Cameco reported 2025 output of 19.1 million pounds of U3O8 at Cigar Lake and 15.1 million at McArthur River and Key Lake, counting each site at 100%. Kazatomprom’s 2025 production was 25.8 thousand tonnes on a 100% basis, about 20% of global primary output by the company’s own estimate.
Company figures use a different basis than the country table. The OECD and IAEA Red Book counted 54,345 tU for 2023, a count that rests on country reports and estimates like the association’s.
The Red Book put identified recoverable resources at 7,934,500 tU as of January 1, 2023, recoverable at costs from $40 to $260 per kgU. Australia held 28% of that total and Kazakhstan 14%.
So the resource ranking doesn’t match the mining ranking. The agencies say the resource base is sufficient for both low and high nuclear growth through 2050 and beyond, if mining investment keeps pace, though EIA classes uranium as nonrenewable.
Where do US reactors get their uranium?
US reactor owners took delivery of 46.9 million pounds of U3O8 equivalent in 2025, and if a nuclear plant feeds your local grid, the fuel inside it was most likely mined abroad.
| Origin | 2021 | 2022 | 2023 | 2024 | 2025 |
|---|---|---|---|---|---|
| Canada | 6,908 | 11,110 | 13,162 | 18,600 | 15,207 |
| Kazakhstan | 16,557 | 10,019 | 10,622 | 12,375 | 13,331 |
| Australia | 6,712 | 3,620 | 10,605 | 8,577 | 7,077 |
| Uzbekistan | 2,499 | 4,438 | 4,887 | 4,503 | 3,258 |
| Namibia | 3,214 | 1,961 | 1,546 | 2,206 | 1,652 |
| Russia | 6,314 | 4,781 | 6,042 | 2,031 | W |
| United States | 2,474 | 2,052 | 2,386 | 4,331 | 3,376 |
| Total foreign | 44,263 | 38,467 | 49,239 | 51,590 | 43,495 |
| Total purchases | 46,736 | 40,519 | 51,625 | 55,921 | 46,871 |
Source: EIA, 2025 Uranium Marketing Annual Report, Table 3. Figures are thousand pounds of U3O8 equivalent delivered in each year, by country where the uranium was mined. W means EIA withheld the figure to avoid disclosing company data.
Russia supplied 12% of US uranium purchases in 2022, and EIA withheld its 2025 figure. Origin means the country where the ore was mined. It’s a different thing from the seller.
How much uranium does the US mine?
US mills and in-situ plants produced 2.1 million pounds of U3O8 in 2025, the most since 2017 in the table below.
| Year | US uranium concentrate production (thousand pounds U3O8) |
|---|---|
| 2011 | 3,991 |
| 2012 | 4,146 |
| 2013 | 4,659 |
| 2014 | 4,891 |
| 2015 | 3,343 |
| 2016 | 2,916 |
| 2017 | 2,443 |
| 2018 | 1,447 |
| 2019 | 174 |
| 2020 | W |
| 2021 | 21 |
| 2022 | 194 |
| 2023 | 50 |
| 2024 | 657 |
| 2025 | 2,109 |
Source: EIA, 2025 Domestic Uranium Production Report, Table 3. W means EIA withheld the figure to avoid disclosing company data.
EIA’s earlier reports show 3.1 million pounds produced in 1993 and 6.3 million in 1996. The World Nuclear Association puts the US peak at 16,800 tU in 1980, when over 250 mines were operating.
At the end of 2025, EIA counted five in-situ recovery plants operating with 13.3 million pounds a year of capacity, five more on standby and seven planned in three states. EPA describes the method as pumping chemicals into groundwater to dissolve uranium from porous rock. If a project is proposed in your county, ask where the wells and the water monitoring sit.
Is uranium dangerous?
Uranium is weakly radioactive. EPA says it decays by alpha particles, so the skin blocks external exposure, and that ingestion is a hazard because of its chemical properties.
Mining leaves the bigger problem. EPA reports that the decay products separated from uranium during milling hold 80% to 90% of the radioactivity in the ore, That is why mill tailings are stored in specially designed disposal cells. Reactors carry their own risks, and whether nuclear power is safe is a separate question.
What has uranium cost over time?
Uranium doesn’t trade on an open exchange, so quoted prices are industry averages. Cameco’s month-end spot price ended 2025 at $81.55 per pound of U3O8 and stood at $91.55 on October 30, 2026.
| Year | Cameco’s month-end spot price, last of year (USD per lb U3O8) | Highest month-end | Lowest month-end |
|---|---|---|---|
| 2004 | 20.60 | 20.60 | 15.55 |
| 2005 | 36.38 | 36.38 | 21.10 |
| 2006 | 72.00 | 72.00 | 37.50 |
| 2007 | 90.00 | 136.00 | 75.00 |
| 2008 | 52.50 | 78.00 | 45.00 |
| 2009 | 44.50 | 51.50 | 42.00 |
| 2010 | 62.25 | 62.25 | 40.75 |
| 2011 | 51.88 | 72.63 | 49.13 |
| 2012 | 43.38 | 52.13 | 41.75 |
| 2013 | 34.50 | 43.88 | 34.50 |
| 2014 | 35.50 | 39.50 | 28.23 |
| 2015 | 34.23 | 39.45 | 34.23 |
| 2016 | 20.25 | 34.70 | 18.00 |
| 2017 | 22.32 | 24.50 | 19.60 |
| 2018 | 27.75 | 29.10 | 21.00 |
| 2019 | 24.93 | 28.90 | 24.05 |
| 2020 | 30.20 | 33.93 | 24.63 |
| 2021 | 42.05 | 45.75 | 27.98 |
| 2022 | 47.68 | 58.20 | 43.08 |
| 2023 | 91.00 | 91.00 | 50.48 |
| 2024 | 72.63 | 100.25 | 72.63 |
| 2025 | 81.55 | 82.63 | 64.23 |
| 2026 (to October 30) | 91.55 | 94.28 | 84.18 |
Source: Cameco, Uranium Price, which averages month-end prices published by UxC and TradeTech. Prices are nominal dollars.
USGS says the spot price rose to a 17-year high of $106 per pound in January 2024, while Cameco’s month-end figure for that January is $100.25. Cameco’s table holds month-end averages, which can sit below a peak inside the month.
The price US reactor owners paid is a separate series. It’s a weighted average of deliveries in each year, and most of it comes from older long-term contracts.
| Delivery year | Purchases (thousand lb U3O8e) | EIA weighted-average price paid (USD per lb U3O8e) |
|---|---|---|
| 2021 | 46,736 | 33.91 |
| 2022 | 40,519 | 39.08 |
| 2023 | 51,625 | 43.80 |
| 2024 | 55,921 | 52.71 |
| 2025 | 46,871 | 58.46 |
Source: EIA, 2025 Uranium Marketing Annual Report, Table 3. Dollars are nominal.
Where these numbers come from
We calculated the 2024 country shares. EIA’s 2.1 million pounds converts to about 811 tU. The rate is 0.3846 tU per thousand pounds, from Cameco’s 21.0 million pounds, which equal 8,078 tU. EIA reports pounds of uranium oxide and WNA reports tonnes of uranium, so the two need that step to compare.
The two price tables measure different things and are kept apart on purpose. We left out forecasts of future prices.
Kazakhstan’s 2026 output and the new US enrichment plants
Kazatomprom expects to produce 27,500 to 29,000 tU in 2026 on a 100% basis. DOE estimates US demand for HALEU could reach 50 metric tons a year by 2035. In the US, the NRC accepted Orano’s application for its Tennessee enrichment plant for review in May 2026.
The material for one of those projects already sits in Ohio and Kentucky. DOE said in April 2026 that it is providing General Matter at least 7,600 cylinders as feedstock and plans about 25,000 for Global Laser Enrichment’s planned plant beside the Paducah site.