Originally published February 4, 2015. Updated September 28, 2026.
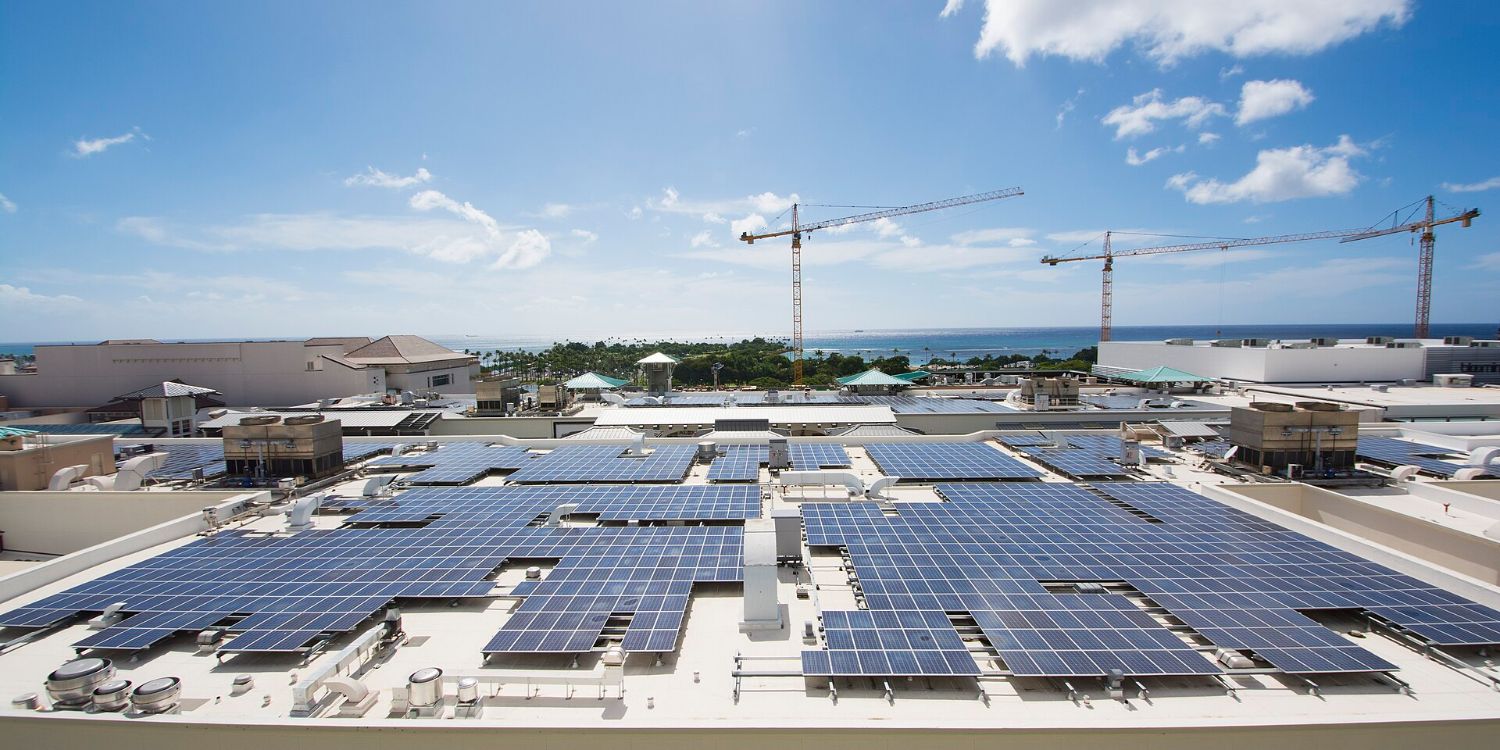
About 49% of Oahu’s single-family homes have solar panels on the roof, and Hawaiian Electric had connected 118,841 small-scale solar systems across its five islands by the end of September 2025. Renewables supplied 37% of the power Hawaiian Electric delivered in 2025. If you’re one of the roughly half of Oahu homeowners without panels yet, there’s a decent chance your neighbor already has some on the roof and a battery in the garage.
Hawaii got here by shutting down its early export incentive and rewriting the payback rules twice, and homeowners answered by keeping more of that power for themselves.
How much of Hawaii’s power comes from solar right now
Renewables made up 37% of the electricity Hawaiian Electric supplied in 2025, up one percentage point from 2024. Solar specifically is harder to pin to one number. SEIA puts solar’s share of Hawaii’s generation at 23.67%, with 2,313 megawatts DC installed in its latest count, spread across utility-scale plants and rooftop systems on homes and businesses.
Nearly half of Oahu’s single-family homes carry part of that capacity on their own roofs, among the 118,841 solar systems Hawaiian Electric had connected across the islands by the end of September 2025. The share runs lower elsewhere in the state, 47% of homes in Maui County and 30% on Hawaii Island, so which island you live on still shapes the odds that your own street already has panels. Hawaii’s utilities generated a combined 9,160,979 megawatt-hours of electricity in 2024, split across five separate island grids instead of one connected network.
Why a new Hawaii solar system almost always comes with a battery now
Rooftop adoption kept climbing after Hawaii cut its rate for exported solar power, and the industry adapted by pairing batteries with new systems instead of selling into the grid at a discount. In Honolulu County, 92.4% of new residential solar permits included a battery in 2025, up from 26.8% in 2017 and 62.7% the year after that. A home battery has become the default part of a new system.
Hawaiian Electric encouraged that shift with Battery Bonus, a program that paid solar customers $850 per kilowatt of battery capacity up front, plus $5 per kilowatt every month for 10 years, delivered as a credit on the power bill. The program closed to new applicants on July 1, 2024. Similar pay-for-flexibility programs have since appeared in states like California and Vermont, all trying to get batteries that are already on a homeowner’s wall to help the shared grid instead of only backing up one house.
For a homeowner today, a battery bank does the job net metering used to do. It stores the power your roof makes at midday so your house can run on it after sundown, instead of sending it to the grid for a lower rate.
What Hawaii’s highest power bills have to do with your roof
None of this is cheap. If you’re paying Hawaii’s average residential bill, you’re handing over $213 a month for power, the highest bill of any state. The national average that year was $144. The reason isn’t a lack of sunshine.
EIA points to petroleum. Most of Hawaii’s grid-delivered electricity still comes from oil-fired plants, even on homes where rooftop solar already cuts what a customer draws from the grid. Hawaii’s average retail electricity price was 38.00 cents per kilowatt-hour in 2024, the highest of any state, well before the grid started running out of room for more rooftop systems.
How Oahu’s circuits pushed Hawaii to end net metering
Picture Oahu’s grid on a clear afternoon. Rooftop panels across the island all push power onto the wires within the same couple of hours around midday, flooding lines that were built mainly to carry electricity one way, from the power plant to the house. By 2015, solar penetration on some circuits was nearing 20%, a level Hawaiian Electric and its regulators worried could threaten the grid’s reliability. The Hawaii Public Utilities Commission responded by ending net metering for new solar customers in October 2015.
Many of Hawaii’s more than 400 circuits on Oahu can still only take on new rooftop solar during peak daytime hours, so where your house sits on the grid can still decide how fast a new system gets approved. Under the old program, homeowners had been credited at the full retail rate, about $0.27 per kilowatt-hour, for solar power they sent back to the grid. Its replacement, Customer Grid Supply, paid new solar customers up to $0.15 per kilowatt-hour for exported power.
The tariffs that replaced net metering, and why batteries won
Two years later, Hawaiian Electric rolled out a second round of tariffs. Smart Export, built for systems paired with a battery, pays zero from 9 a.m. to 4 p.m. for power sent to the grid. Outside that window, it pays about $0.15 per kilowatt-hour, capped at 25 megawatts statewide. Customer Grid Supply Plus, for systems without storage, pays roughly $0.101 per kilowatt-hour on Oahu, capped at 35 megawatts.
If you’re comparing the two, the math explains why nearly every new system on Oahu now ships with a battery. Exporting at midday for about ten cents a kilowatt-hour is a worse trade than storing that same power and using it yourself after dark, when Hawaii’s average retail rate ran 38.00 cents per kilowatt-hour in 2024. Readers curious how net metering works in states that still offer it can see how net metering works.
Retiring coal and reaching for 100% renewable by 2045
Hawaii shut down its last coal plant, on Oahu, in 2022. The AES-owned plant had supplied up to 20% of Oahu’s electricity before it closed. Hawaii is now working toward a legally required target of 100% renewable electricity by 2045, a law signed in June 2015.
The law set an early checkpoint of 30% renewable by 2020, already passed, and the next one due is 40% by 2030. A later checkpoint calls for 70% by 2040, five years ahead of the full 100% deadline. Every checkpoint after this one still runs through Hawaiian Electric’s fuel mix, and eventually through your bill, since the push toward that next target leans on the same rooftop solar and batteries already covering close to half of Oahu’s homes.
Hawaii’s rooftop boom now has to outrun record demand growth
Hawaiian Electric’s 37% renewable milestone in 2025 came with a warning attached. The utility’s own announcement paired that gain with the state’s biggest jump in electricity demand since 2004, a 2.5% rise in electricity use in a single year. Rooftop solar and batteries have grown fast enough before to reach about half of Oahu’s homes. Whether they can outrun a demand jump this size, and keep your bill from climbing past the $213 a month Hawaii already pays, is the honest question these numbers leave open.


