Originally published August 25, 2014. Updated November 12, 2026.
No, according to a 2020 peer-reviewed study that found backing a mostly renewable California grid with batteries raised its energy return by about 10%. That cuts against a widely cited 2014 argument that storage would wreck the energy return of wind and solar. Batteries have also gone from a rounding error to 54.1 gigawatts on the US grid at the end of August 2026, though most of them hold only a few hours of power, so carrying a grid through a windless week is still beyond them.
Top battery energy storage statistics
- The US had 54.1 GW of utility-scale battery capacity at the end of August 2026, measured as net summer capacity.
- US battery capacity grew by an average of 70% a year from 2023 to 2025, reaching 43.6 GW at the end of 2025.
- Operators plan to add 26.8 GW of batteries in 2027, according to EIA’s September 2026 generator inventory.
- The IEA counted 108 GW of battery storage added worldwide in 2025, about 40% more than in 2024.
- California’s battery fleet reached 21,112 MW in August 2026, which the state calls the nation’s largest.
- Batteries supplied an average of 15% of California’s load from 5 p.m. to 10 p.m. in 2025.
- Battery packs for stationary storage cost $70 per kWh in 2025, 45% less than in 2024.
- NREL puts a complete four-hour utility-scale battery system at $334 per kWh in 2024, in 2024 dollars.
How much battery storage does the US grid have?
The US had 54.1 GW of battery storage at August 2026, and EIA’s September inventory lists 56.1 GW of operating nameplate capacity. The two differ because one counts summer capacity and the other counts nameplate ratings.
| Year (December) | US utility-scale battery capacity (GW) |
|---|---|
| 2018 | 0.85 |
| 2019 | 1.02 |
| 2020 | 1.65 |
| 2021 | 4.67 |
| 2022 | 8.84 |
| 2023 | 15.36 |
| 2024 | 26.21 |
| 2025 | 42.74 |
Source: EIA Preliminary Monthly Electric Generator Inventory, operating batteries by nameplate capacity, December files for 2018, 2019, 2020, 2021, 2022, 2023, 2024 and 2025.
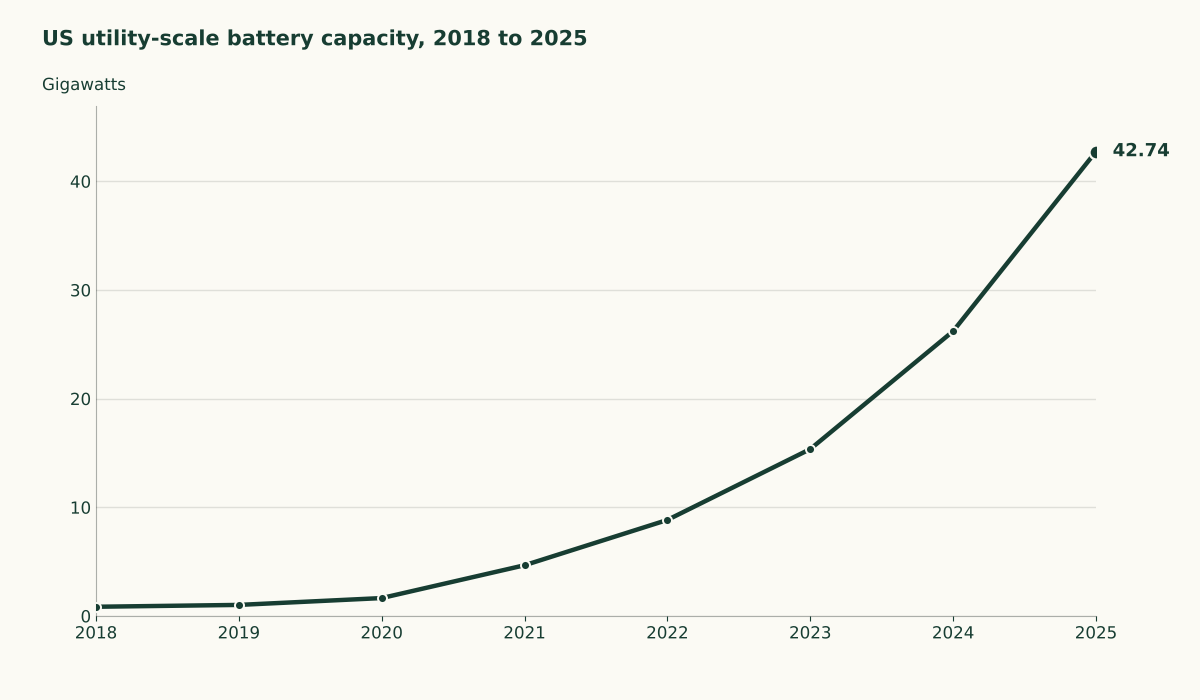
Capacity in the table grew about 50-fold between December 2018 and December 2025. In 2024 alone, generators added 10.4 GW of new battery capacity, the second-largest addition that year after solar.
Operators have more on the way. These are plans operators reported to EIA, and plans slip.
| Planned operation year | Planned US battery additions (GW) |
|---|---|
| Rest of 2026 | 9.65 |
| 2027 | 26.85 |
| 2028 | 15.24 |
| 2029 | 9.10 |
| 2030 | 2.18 |
Source: EIA Preliminary Monthly Electric Generator Inventory, September 2026, Planned sheet.
How much battery storage does the world have?
Developers added 108 GW of battery storage worldwide in 2025, up around 40% from 2024, according to the IEA. Ember counted a record 118 GW of storage added in 2025 and says battery additions have grown by almost 80% a year since 2020.
Both figures are additions for one year, and neither is a running total. Ember’s release doesn’t say which technologies its figure covers, so the two aren’t directly comparable.
Ember also estimates that battery deployment grew 46% to about 250 GWh in 2025, which measures energy over time instead of power at a moment. National targets add up to 822 GW of storage by 2030 across 99 countries and the EU, short of the 1,500 GW pledged at COP29.
What does a battery energy storage system do on the grid?
A battery energy storage system charges when power is plentiful and cheap and sends it back when demand peaks. Most large systems in operation have a maximum duration of 4 hours, according to California’s grid operator, CAISO, which says they mostly buy power at midday when solar is plentiful and sell it back in the evening, when prices are higher.
Think of a reservoir that fills while solar floods the grid at midday and drains after sunset.
That evening stretch is when you get home, cook dinner and turn on the AC. In 2025, the average output of batteries in CAISO’s market peaked at about 9,100 MW in the hour ending 7 p.m., up from 5,700 MW in 2024. California calls its fleet the nation’s largest, and EIA found CAISO’s own battery capacity rose 79% to 16 GW between April 2024 and April 2026.
Texas runs the same playbook. ERCOT’s own summer review says storage resources helped serve record net loads in 2026, the summer it set an all-time demand record of 91,134 MW on July 22. Grid-data firm GridStatus, a secondary source, reported a battery discharge record of 11,980 MW the same day. ERCOT’s review adds that storage resources dominate ancillary service awards, especially for regulation.
Batteries are also stacking up beside the power grid that aging wires and rising demand already strain,.
Most grid batteries cover only a few hours
The global average energy storage duration is 2.5 hours, and Wood Mackenzie says it must rise to around 20 hours to keep grids reliable as wind and solar grow. EIA found that US batteries built through 2020 could run at full power for about 3.0 hours on average.
Money for longer storage is shrinking. Funding for long-duration storage fell 30% globally in 2025, and venture capital investment in it fell 72%. The 30% leaves out about $1.8 billion that the US Department of Energy set aside for Hydrostor.
That’s the part of the 2014 argument that still holds up. A battery that lasts four hours gets you through the evening peak. A calm, cloudy week is a different problem.
How much does battery storage cost?
A complete four-hour utility-scale battery system cost $334 per kilowatt-hour in 2024, in 2024 dollars, in NREL’s baseline. The pack is one component of that. NREL’s cost model also counts the inverter and the other hardware needed for installation.
| Cost measure | Value ($ per kWh) | Scope | Year |
|---|---|---|---|
| Stationary storage battery pack | 70 | Pack only, global survey | 2025 |
| Electric vehicle battery pack | 99 | Pack only, global survey | 2025 |
| Average lithium-ion pack | 108 | All segments, global survey | 2025 |
| Four-hour utility-scale system | 334 | Complete system, US, 2024 dollars | 2024 |
Source: BloombergNEF battery price survey, December 2025 and NREL, Cost Projections for Utility-Scale Battery Storage: 2025 Update.
The pack figures and the system figure measure different things, so don’t subtract one from the other. Stationary packs became the cheapest segment for the first time in 2025, ahead of the electric car battery packs at $99.
Ember estimates battery costs fell 45% in 2025 after a 20% drop in 2024. The IEA puts the fall in battery costs at more than 90% between 2010 and 2025.
How a home battery differs from a grid battery
A home battery is sized for one house and does a different job than the batteries utilities build beside solar and wind farms. The Tesla Powerwall 3 stores 13.5 kilowatt-hours and carries a 10-year warranty. Tesla rates its solar-to-battery-to-home efficiency at 89%, using its own test method.
The average US home used 10,791 kilowatt-hours in 2022, roughly 30 a day, so if your household matches that average, one Powerwall covers a little under half a day. Its main job is keeping your lights and refrigerator running when the grid goes down, a job that used to fall to a generator and is what home battery backup systems are bought for.
| Home battery | Grid-scale battery | |
|---|---|---|
| Example | Powerwall 3 | California’s fleet |
| Capacity | 13.5 kWh | 21,112 MW |
| Warranty | 10 years | Varies by project |
| Main job | Backs up a house during an outage | Shifts solar and wind power to match demand |
Source: Tesla Powerwall 3 datasheet and California Energy Commission, August 2026.
The 2014 argument against storage
In August 2014, John Morgan wrote “The Catch-22 of Energy Storage” on the blog Brave New Climate. He asked a fair question. If wind and solar need storage to be reliable, does building that storage cost so much energy that the whole system barely breaks even?
His case rested on EROI, or energy return on investment, which counts how many units of energy a source delivers over its life for every unit spent building and running it. The researcher Weißbach calculates a minimum viable return of about 7 for the United States and the European Union.
In his numbers, wind’s return of around 16 fell to about 3.9 once storage buffering was added. His solar and battery figures are in the table below.
Why the numbers look different now
Studies that followed Morgan reach different answers, because each one draws the boundary around the system in a different place.
| Study | Year | What it modeled | Result (energy return) |
|---|---|---|---|
| Morgan | 2014 | Wind with storage buffering | 16 falls to 3.9 |
| Morgan | 2014 | Solar PV with pumped hydro | 3.5 falls to 1.6 |
| Morgan | 2014 | Batteries versus pumped hydro | About 10 times the energy per unit stored |
| Raugei and colleagues | 2020 | California grid, 80% renewable, with batteries | 10% higher than the 2018 grid |
| Müller and Chartouni | 2022 | Home solar in Spain with an 18 kWh battery | 8 rises to 15 versus curtailing |
| Sahin | 2024 | Nine global transition scenarios to 2050 | All above a cliff of about 10 |
Source: Brave New Climate, Energies, 2020, Applied Energy, 2022 and Nature Communications, 2024.
The direct test of Morgan’s question came in 2020, when Raugei, Peluso, Leccisi and Fthenakis modeled California’s 2030 grid at 80% renewable with lithium-ion batteries and compared it with the state’s 2018 mix. The battery-backed grid came out with the higher energy return.
A 2022 study found that adding a battery to home solar raised Spain’s energy return from around 8 to 15 compared with wasting the extra solar power.
A 2024 paper in Nature Communications adds a caution. In its nine global scenarios, all stayed above the net energy cliff of around 10, yet the authors found that storage integrated into generators leads to a large drop in overall energy return. The authors also point to methodological inconsistencies in earlier energy-return studies.
Morgan’s underlying point, that storage takes real energy to build, still stands. Raugei and colleagues in 2020 and Müller and Chartouni in 2022 found that cost small enough for batteries to come out ahead.
Where these numbers come from
We built the history table by summing every battery listed as operating in EIA’s December generator inventory for each year, using nameplate capacity. Each file is a snapshot from its own time, so the December 2025 file shows 42.7 GW while EIA reports 43.6 GW at the end of 2025 in a later article. The IEA and Ember numbers describe additions in a single year, and the planned-additions table shows operators’ plans.
Why a calm week still needs another kind of power plant
Packs cost a fraction of what they did when Morgan wrote, and the 2020 California model found a battery-backed grid with a higher energy return. Duration is what batteries haven’t solved. A battery covers the evening, and a calm week stays with other power plants.
Solar and wind plants have their own capacity factors, the share of their rated output they deliver over a year. Where a grid has more solar than it can use at midday, the duck curve is the limit, and batteries are one way to soak up the surplus.
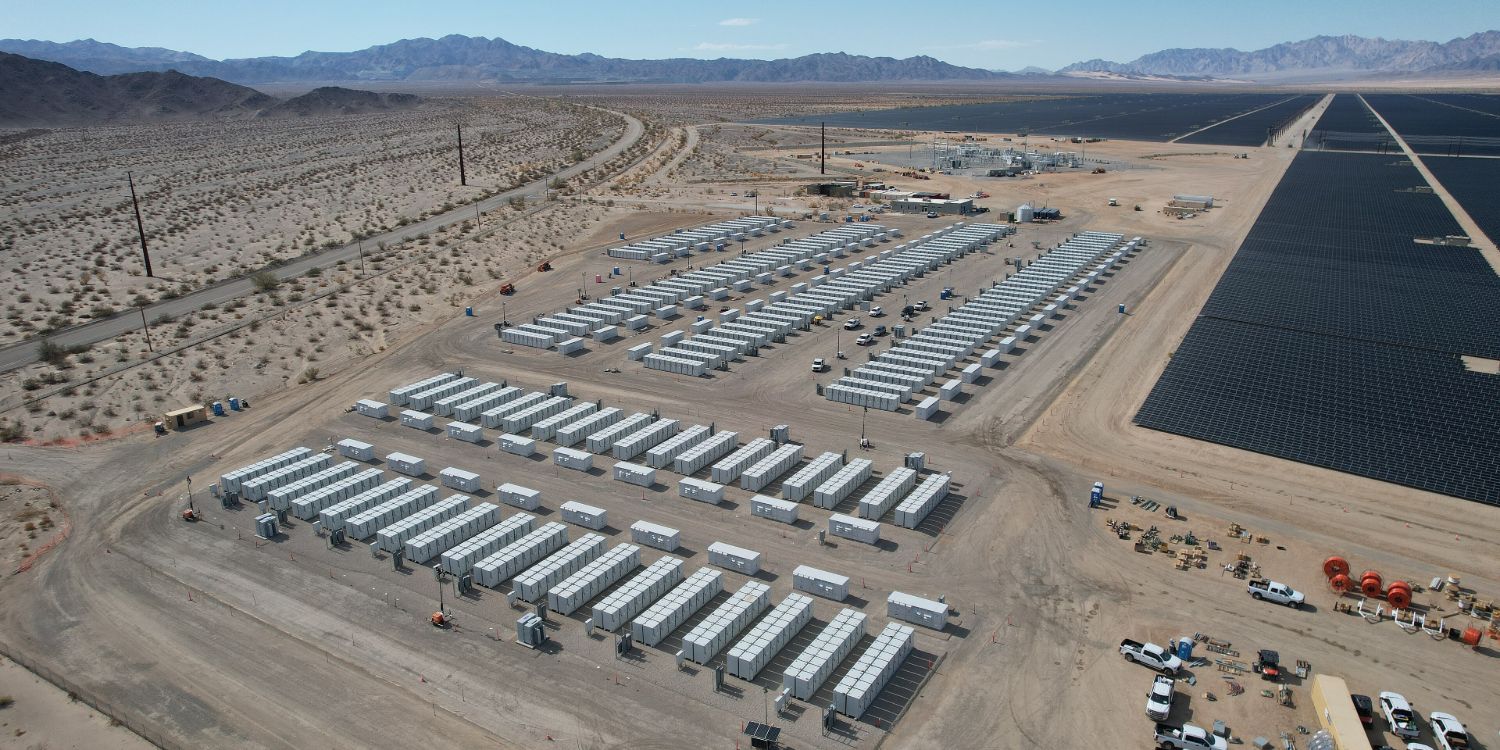
The next step is already on EIA’s list. The Bellefield solar and storage site in California began operating in December 2025, and EIA says a planned doubling of its 500 MW of storage would make it the largest power storage facility in the US.