Renewable energy is energy from sources that nature replenishes faster than people use them, and it made 33.8% of the world’s electricity in 2025, ahead of coal. In the US, renewables made about 24% of utility-scale electricity that year, roughly one kilowatt-hour in four. Nuclear doesn’t count, because EIA classes uranium as a nonrenewable source. The figures below come mostly from Ember, EIA, IRENA and the IEA, and they describe 2025 unless a line says otherwise.
Top renewable energy statistics
- Renewables generated 33.8% of the world’s electricity in 2025 and overtook coal at 33.0%, which Ember calls a first in 100 years.
- Solar output rose 30% to 2,778 terawatt-hours in 2025, and solar passed wind as a world electricity source for the first time.
- Wind and utility-scale solar made 17% of US electricity in 2025, or 19% once rooftop solar is counted.
- Hydropower remains the world’s largest source of renewable electricity, and IHA counted 1,469 gigawatts installed at the end of 2025, pumped storage included.
- Solar power cost a global average of $44 per megawatt-hour in 2025, 89% below its 2010 cost.
- IRENA reports that more than 90% of the utility-scale renewable projects commissioned in 2025 cost less than the cheapest new fossil alternative.
- The IEA forecasts that world renewable capacity will double by 2030, adding 4,600 gigawatts.
- US developers plan a record 86 gigawatts of new generating capacity in 2026, and solar is 51% of that plan.
- Renewable energy employed at least 16.6 million people worldwide in 2024, according to IRENA and the International Labour Organization.
What is renewable energy?
Renewable energy is energy from sources that are naturally replenishing but flow-limited, and EIA says the resources are virtually inexhaustible but limited by their availability. The UN describes it as energy from natural sources replenished at a higher rate than they are consumed, with sunlight and wind as its examples.
EIA lists the major types as biomass, hydropower, geothermal, wind and solar. Biomass includes wood and wood waste as well as biofuels.
Nonrenewable sources are the opposite. EIA says they’re mined or extracted from the earth, and crude oil is its example.
Nuclear needs its own answer. EIA considers uranium a nonrenewable energy source, even though it’s a common metal found in rocks worldwide. Ember reports it separately too, with nuclear at 8.9% of world electricity in 2025, and it adds nuclear to renewables only under a separate label, low-carbon power, which reached 42.6%. The outlook for nuclear power is covered on its own page.
What are the main renewable energy sources?
The main renewable sources are solar, wind, hydropower, bioenergy, geothermal and marine energy. The table shows how much of each was installed at the end of 2025.
| Source | Capacity at end of 2025 (GW) | Added in 2025 (GW) | Growth in 2025 (%) |
|---|---|---|---|
| Solar | 2,392 | 511 | 27.2 |
| Hydropower (excludes pure pumped storage) | 1,296 | 18.4 | 1.4 |
| Wind | 1,291 | 159 | 14.0 |
| Bioenergy | 154 | 3.4 | 2.3 |
| Geothermal | 16 | 0.3 | 1.7 |
| Marine | 0.5 | Not reported | Not reported |
| All renewables | 5,149 | 692 | 15.5 |
Source: IRENA, 2026 renewable capacity report. Hydropower excludes pure pumped storage, which IRENA counts separately. Capacity measures what has been built and says nothing about how much power it generated.
Hydropower and wind are nearly level in the table. Geothermal and marine energy are small, and a section below covers them.
How much of the world’s electricity is renewable?
Renewables’ share of world electricity rose from 18.04% in 2001 to 33.78% in 2025, counting solar, wind, hydropower, bioenergy and other renewables and leaving nuclear out.
| Year | US renewables share of electricity (%) | World renewables share of electricity (%) |
|---|---|---|
| 2001 | 7.5 | 18.04 |
| 2002 | 8.75 | 17.91 |
| 2003 | 9.03 | 17.44 |
| 2004 | 8.73 | 17.98 |
| 2005 | 8.75 | 18.1 |
| 2006 | 9.43 | 18.23 |
| 2007 | 8.39 | 17.98 |
| 2008 | 9.18 | 18.91 |
| 2009 | 10.54 | 19.47 |
| 2010 | 10.31 | 19.72 |
| 2011 | 12.46 | 20.02 |
| 2012 | 12.19 | 20.98 |
| 2013 | 12.83 | 21.72 |
| 2014 | 13.35 | 22.25 |
| 2015 | 13.63 | 22.97 |
| 2016 | 15.29 | 23.74 |
| 2017 | 17.46 | 24.47 |
| 2018 | 17.44 | 25.08 |
| 2019 | 18.3 | 26.08 |
| 2020 | 20.31 | 27.99 |
| 2021 | 20.75 | 28.11 |
| 2022 | 22.34 | 29.48 |
| 2023 | 22.68 | 30.34 |
| 2024 | 24.07 | 31.95 |
| 2025 | 25.63 | 33.78 |
Source: Ember, Yearly Electricity Data, full release CSV, downloaded September 30, 2026. Ember amends this file, so a later download can differ slightly.
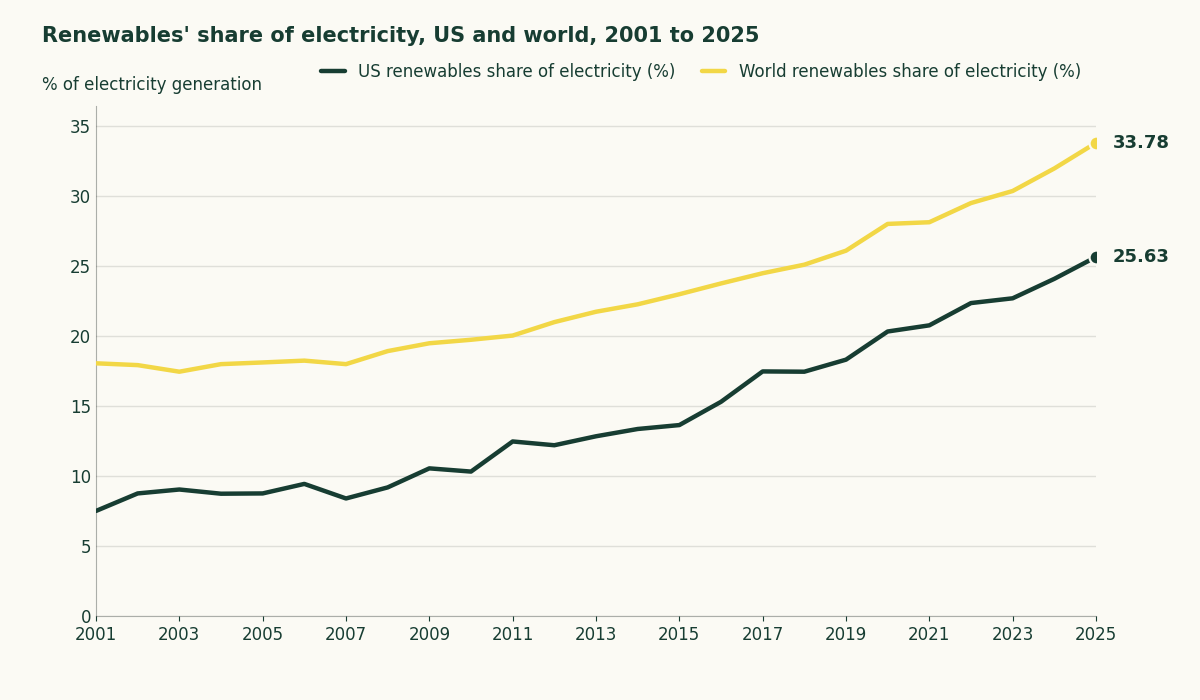
The world share was flat through most of the 2000s and has risen every year from 2008 to 2025. The US series is bumpier, and it stayed below the world’s in every year.
How much US electricity is renewable?
EIA counts renewables at about 24% of US utility-scale electricity in 2025, up from about 12% in 1990, and utility-scale means plants of 1 megawatt and up.
Utility-scale plants made 464,000 gigawatt-hours of wind power and 296,000 of solar power in 2025. Small-scale solar added about 93,000 gigawatt-hours, and counting it lifts wind and solar to 19% of US generation. If you have panels on your roof, your system sits in that small-scale group.
Ember counts small-scale solar in its US total, which is why its figure runs higher than EIA’s. The table gives the US and world split by source.
| Source | US generation, 2025 (TWh) | US share of electricity (%) | World generation, 2025 (TWh) | World share of electricity (%) |
|---|---|---|---|---|
| Hydropower | 241.7 | 5.35 | 4,432.3 | 13.97 |
| Wind | 464.39 | 10.27 | 2,711.9 | 8.55 |
| Solar | 388.82 | 8.6 | 2,778.6 | 8.76 |
| Bioenergy | 46.19 | 1.02 | 704.94 | 2.22 |
| Other renewables | 17.7 | 0.39 | 89.32 | 0.28 |
| All renewables | 1,158.8 | 25.63 | 10,717.06 | 33.78 |
| Nuclear (not renewable) | 784.78 | 17.36 | 2,812.39 | 8.86 |
Source: Ember, Yearly Electricity Data, which includes small-scale solar. Nuclear is shown as a comparison and isn’t part of the renewable total.
Hydropower leads worldwide and wind leads in the US. On its own utility-scale basis, EIA puts US hydropower at about 5.6% of electricity and 23.1% of the renewable total.
Why the renewable share depends on what you measure
Renewables are a bigger share of world power capacity than of the electricity generated, and a much smaller share of all energy. All the figures in the table are right, and they answer different questions.
| What is measured | Scope | Renewables share, 2025 (%) | Source |
|---|---|---|---|
| Share of electricity generation | World | 33.8 | Ember |
| Share of electricity generation | US (utility-scale only) | 24 | EIA |
| Share of electricity generation | US (adds small-scale solar) | 25.6 | Ember |
| Share of installed capacity | World | 49.4 | IRENA |
| Share of installed capacity | US (utility-scale) | 33.0 | FERC via Electrek |
| Share of total energy | World | 8.6 | Energy Institute via Our World in Data |
| Share of total energy | US | 9 | EIA (primary energy consumption) |
| Share of total energy | US | 7.2 | Energy Institute via Our World in Data |
Source: Ember, Global Electricity Review 2026, EIA, Electricity in the U.S., IRENA, 2026 renewable capacity report, Electrek, reporting FERC data, Our World in Data, using Energy Institute data and EIA, U.S. energy facts.
Total energy includes fuel for heat and transport. EIA reports renewables at about 9% of US primary energy consumption in 2025, a record, while the Energy Institute series gives 7.2% for the US and counts energy differently. Biomass shows how wide the gap can get. It supplied about 5% of US primary energy in 2025, yet the Ember table above puts it at 1.02% of US electricity.
How fast are solar and wind growing?
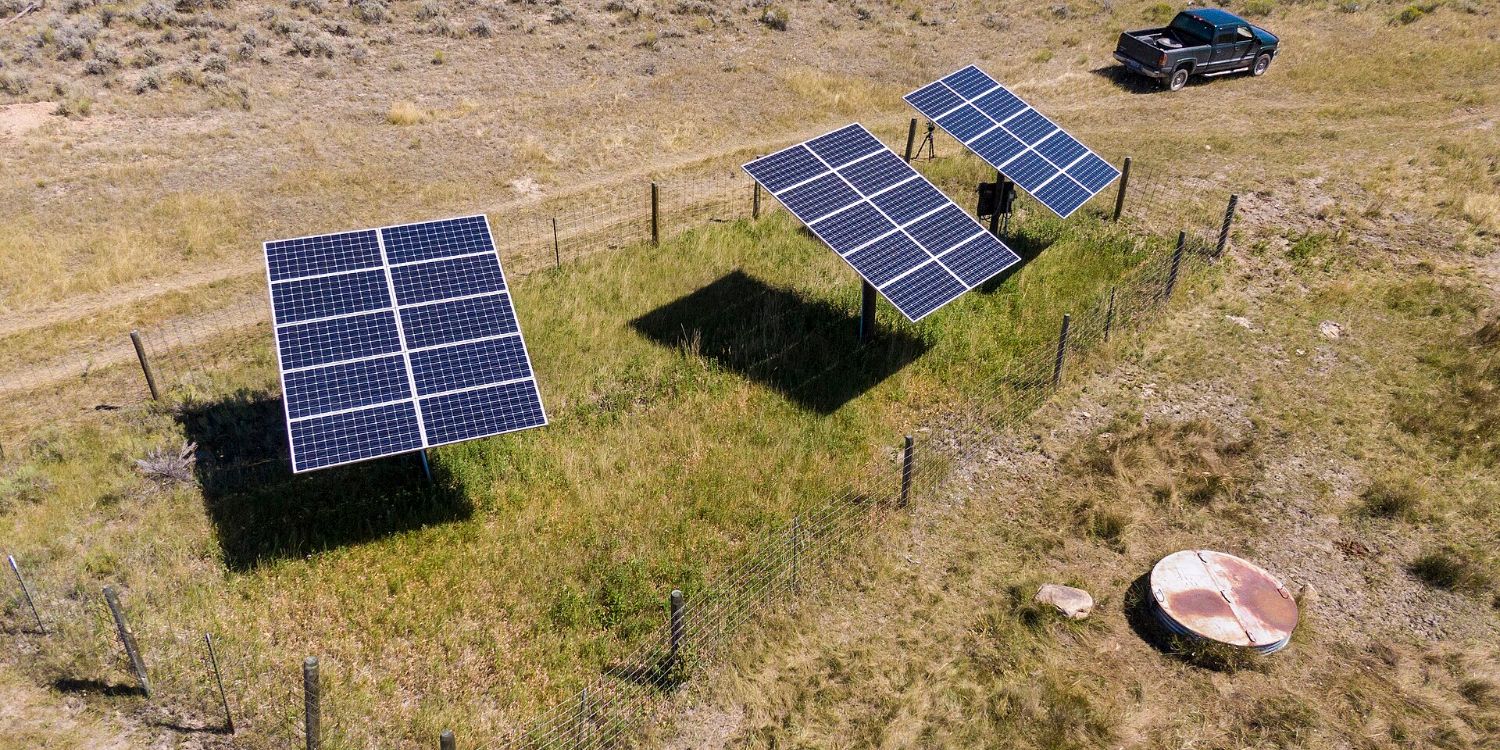
A photovoltaic cell turns sunlight directly into electricity, with no turbine in between. IRENA counts 511 gigawatts of new solar in 2025 against 159 of new wind.
Ember counted 647 gigawatts of solar added in 2025, measured in direct current, so it shouldn’t be compared with IRENA’s figure. Wind has three counters. GWEC reports 165 gigawatts of new wind in 2025, a 40% rise. Ember counts 167 gigawatts.
In the US, FERC’s data show utility-scale solar at 12.2% of installed capacity, ahead of wind at 11.9% at the end of 2025. Two pages go deeper on each, US solar growth and wind power growth.
What about hydropower, geothermal, biomass and the smaller sources?
In a hydropower plant, water flows through a pipe and turns the blades of a turbine that spins a generator. IHA counted 28 gigawatts of new hydropower in 2025, including about 11.7 gigawatts of pumped storage. Pumped storage has passed 200 gigawatts worldwide, and DOE puts the firm capacity of US hydropower, its guaranteed minimum output, at over 24 gigawatts.
Geothermal plants use water or steam at 300 to 700 degrees Fahrenheit from wells that are sometimes 2 miles deep. Fervo Energy says its Cape Station in Utah reached First Power on September 24, 2026, the first utility-scale enhanced geothermal project to do so, with 900 MW fully contracted. For the engineering, see how enhanced geothermal systems work.
Of the biomass energy the US used in 2025, 53% was biofuels and 39% was wood, and only 7% went to electric power.
Marine energy is tiny. The US has no commercially operating tidal power plants, and the waves off US coasts hold a theoretical 2.64 trillion kilowatt-hours a year, which is potential and not what devices can capture. Solar thermal plants use mirrors to concentrate sunlight and make steam, and some store heat for the evening.
What does renewable energy cost?
Lazard puts unsubsidized US utility-scale solar at $40 to $98 per megawatt-hour in 2026.
On the scale of your power bill, that converts to 4.0 to 9.8 cents per kilowatt-hour. Lazard says unsubsidized renewables remain the most cost-competitive new build, though the cost of electricity is rising for every type of generation. IRENA’s world averages show which sources got cheaper.
| Source | Global average cost of electricity, 2025 (USD per MWh) | Change since 2010 (%) |
|---|---|---|
| Onshore wind | 33 | -71 |
| Solar PV | 44 | -89 |
| Hydropower | 62 | +41 |
| Offshore wind | 78 | -63 |
| Bioenergy | 86 | -3 |
| Geothermal | 89 | +53 |
| Concentrated solar power | 115 | -72 |
Source: IRENA, Renewable power generation costs in 2025. Global weighted averages of new projects in 2025 dollars. Solar PV’s 2025 average was unchanged from 2024. Cost of electricity is not the price a buyer pays.
Adding a gigawatt of solar took about $0.7 billion in 2025 against about $3 billion in 2015, the IEA says.
What are the pros and cons of renewable energy?
One limit is the grid. California’s grid operator curtailed 3.4 million megawatt-hours of wind and solar in 2024, and solar was 93% of it. In the US, about 2,061 gigawatts of generation and storage was waiting for a grid connection at the end of 2025, according to Lawrence Berkeley National Laboratory. How that plays out is the subject of the page on the limits of the renewable grid.
Batteries are one answer. US utility-scale batteries reached 43.6 gigawatts at the end of 2025, and operators plan 54 gigawatts more over the next two and a half years.
Renewables also bring jobs and low emissions. The world had at least 16.6 million renewable energy jobs in 2024, and DOE’s survey counted 359,400 US solar power generation workers in 2025, 3% fewer than in 2024. Over a full lifecycle, onshore wind has a median of 11 grams of CO2-equivalent per kilowatt-hour in IPCC’s 2014 assessment, and coal has 820.
| Source | Minimum (gCO2eq per kWh) | Median (gCO2eq per kWh) | Maximum (gCO2eq per kWh) |
|---|---|---|---|
| Coal (pulverized) | 740 | 820 | 910 |
| Natural gas (combined cycle) | 410 | 490 | 650 |
| Biomass (dedicated) | 130 | 230 | 420 |
| Solar PV (utility) | 18 | 48 | 180 |
| Solar PV (rooftop) | 26 | 41 | 60 |
| Geothermal | 6.0 | 38 | 79 |
| Concentrated solar power | 8.8 | 27 | 63 |
| Hydropower | 1.0 | 24 | 2,200 |
| Wind (offshore) | 8.0 | 12 | 35 |
| Nuclear | 3.7 | 12 | 110 |
| Wind (onshore) | 7.0 | 11 | 56 |
Source: IPCC, Fifth Assessment Report, Working Group III, Annex III, Table A.III.2. Lifecycle emissions include building and fuel supply. Hydropower’s range is the widest.
Where these numbers come from
World electricity shares come from Ember and US shares from EIA, and the two count differently by design. EIA counts utility-scale plants, while Ember adds small-scale solar and IRENA counts capacity. We converted Lazard’s dollars per megawatt-hour to cents per kilowatt-hour by dividing by ten. Ember revises its data file, so a later download can differ slightly.
The 2026 US build plan
EIA says US developers plan 86 gigawatts of new capacity in 2026, a record if they finish it, and 53 gigawatts were added in 2025.
| Source | Planned US utility-scale additions, 2026 (GW) | Share of the 86 GW plan (%) |
|---|---|---|
| Solar | 43.4 | 51 |
| Battery storage | 24 | 28 |
| Wind | 11.8 | 14 |
| Natural gas | 6.3 | Not reported |
Source: EIA, Today in Energy, February 20, 2026. Plans are what developers report, and they can slip.
Solar carries the plan and batteries come second. The IEA expects solar to account for almost 80% of the 4,600 gigawatts of new renewable capacity by 2030. Before you compare any two renewable energy shares, check whether each one counts electricity, capacity or total energy.