In 2025 a heat pump had to reach a seasonal COP of about 3.25 to cost the same to run as a 95% efficient gas furnace, going by EIA’s national average electricity price and its residential gas price. A high-efficiency heat pump lands at about that line, and a minimum-efficiency one sits well above it.
A heat pump needs a far lower COP to break even in Florida than in Michigan, so the answer turns on your state’s gas and electricity prices.
Top heat pump vs furnace statistics
- ENERGY STAR requires gas furnaces to reach 95% AFUE in the South and 97% in the North.
- In 8 of the 19 sample states, a best-available heat pump costs less to run than a 95% gas furnace, using EIA’s 2025 state electricity prices.
- DOE puts the average life of a gas furnace at 21.5 years.
- Heat pumps in DOE’s cold climate field tests delivered a median COP of 1.9 when the outdoor temperature was 0 to 5°F.
- AHRI members shipped 3,644,596 heat pumps and 3,247,426 gas furnaces in 2025.
- Gas central furnaces were the main heating equipment in 53.26 million US homes in 2020, against 16.13 million with a heat pump.
- On the 2023 US average grid, a high-efficiency heat pump emits about 70 lb of CO2 per million Btu delivered, against 123 lb for a 95% gas furnace.
- The federal 25C credit paid up to $2,000 a year for a heat pump, and it isn’t allowed on equipment placed in service after December 31, 2025.
Is a heat pump cheaper to run than a gas furnace?
Gas heat rose faster in price than heat-pump heat. Between 2016 and 2025 the cost of a million Btu of delivered heat from a 95% efficient gas furnace climbed 52.7%, against 37.9% for a best-available heat pump, by the table’s calculation.
COP is the heat a machine delivers per unit of electricity, and how a heat pump works is covered on its own page. The table uses two ratings. One is HSPF2 7.5, the federal minimum for a split-system heat pump. The other is HSPF2 11, the best available model in DOE’s purchasing example, and dividing a rating by 3.412, the Btu in a watt-hour, gives the seasonal COP.
| Year | Gas furnace 95% AFUE ($ per MMBtu delivered) | Heat pump COP 2.2 ($ per MMBtu delivered) | Heat pump COP 3.2 ($ per MMBtu delivered) | Electric furnace ($ per MMBtu delivered) |
|---|---|---|---|---|
| 2016 | 10.21 | 16.73 | 11.41 | 36.78 |
| 2017 | 11.09 | 17.19 | 11.72 | 37.78 |
| 2018 | 10.67 | 17.16 | 11.70 | 37.72 |
| 2019 | 10.68 | 17.35 | 11.83 | 38.13 |
| 2020 | 10.95 | 17.53 | 11.95 | 38.54 |
| 2021 | 12.38 | 18.21 | 12.42 | 40.04 |
| 2022 | 14.99 | 20.05 | 13.67 | 44.08 |
| 2023 | 15.65 | 21.33 | 14.55 | 46.89 |
| 2024 | 14.73 | 21.97 | 14.98 | 48.30 |
| 2025 | 15.59 | 23.07 | 15.73 | 50.70 |
Source: EIA, Electric Power Monthly, Table 5.3, EIA, residential natural gas price, EIA, heat content of natural gas and EIA, Btu conversions. Costs are calculated from these figures in nominal dollars, with natural gas at 1,036 Btu per cubic foot for every year.
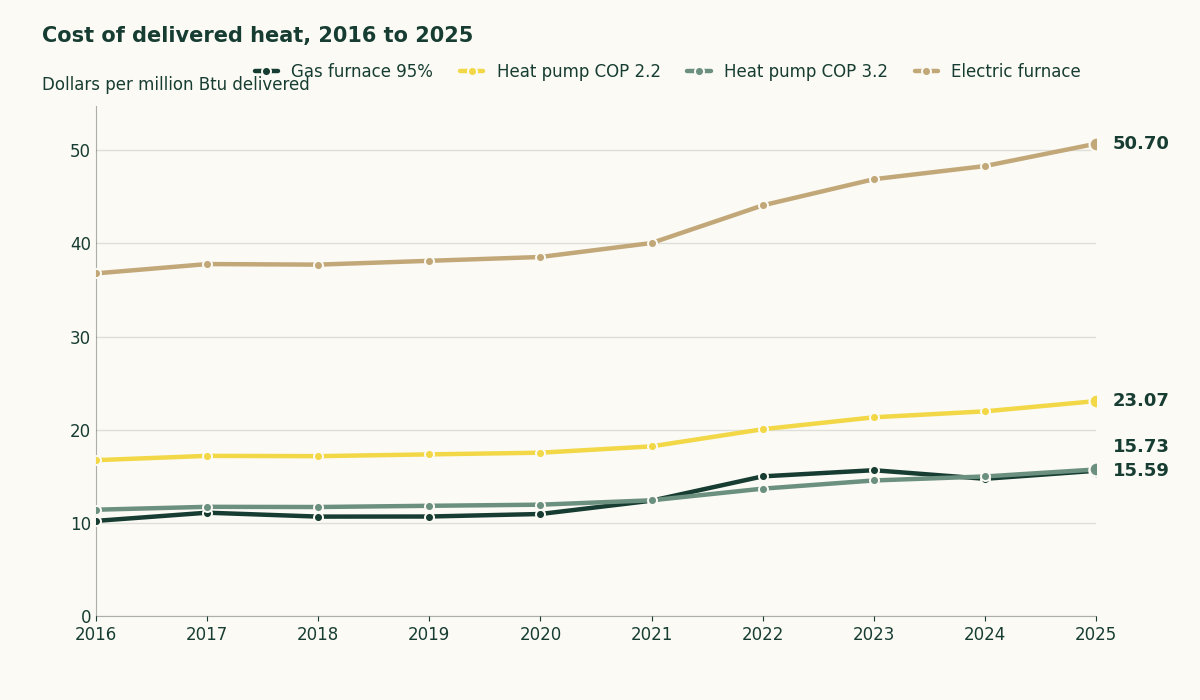
In the table, the high-efficiency heat pump cost less than the furnace in two of the ten years, and the entry-level one cost more in all ten.
To check your own house, multiply your power rate in cents per kWh by 2.93 to get dollars per million Btu at a COP of 1, then divide by the heat pump’s COP. Compare that with your gas price per million Btu divided by your furnace’s AFUE. The COP at which the two match is your break-even COP.
How does a heat pump compare with an electric furnace?
EIA counted 13.82 million US homes with an electric central warm-air furnace as main heating equipment in 2020.
In the table above, electric furnace heat costs more than twice as much as even a minimum-efficiency heat pump’s in every year. A heat pump typically needs about half the energy that other electric home-heating sources do, EPA says.
Which states favor a heat pump on running cost?
A heat pump at the best-available rating beats a 95% gas furnace on running cost in Florida, Georgia, Texas, Washington, Arizona, Virginia, Oregon and Tennessee, and the furnace stays cheaper in the rest of the table, going by EIA’s 2025 gas prices and the electricity prices below.
The last column is the seasonal COP a heat pump needs to break even with the furnace in that state. Compare it with the seasonal COP on a heat pump’s spec sheet, or work one out from its efficiency rating the way the running-cost section explains.
| State | Electricity (cents per kWh) | Natural gas ($ per Mcf) | Gas furnace 95% AFUE ($ per MMBtu delivered) | Heat pump HSPF2 7.5 ($ per MMBtu delivered) | Heat pump HSPF2 11 ($ per MMBtu delivered) | Break-even COP vs 95% furnace |
|---|---|---|---|---|---|---|
| U.S. average | 17.30 | 15.34 | 15.59 | 23.07 | 15.73 | 3.25 |
| Michigan | 20.01 | 10.92 | 10.84 | 26.68 | 18.19 | 5.41 |
| Wisconsin | 18.16 | 10.74 | 10.78 | 24.21 | 16.51 | 4.94 |
| Illinois | 17.69 | 11.25 | 11.30 | 23.59 | 16.08 | 4.59 |
| New York | 26.39 | 17.58 | 17.93 | 35.19 | 23.99 | 4.31 |
| Minnesota | 15.82 | 10.98 | 10.96 | 21.09 | 14.38 | 4.23 |
| California | 32.54 | 22.01 | 22.67 | 43.39 | 29.58 | 4.21 |
| Colorado | 15.85 | 11.17 | 11.03 | 21.13 | 14.41 | 4.21 |
| Vermont | 22.92 | 18.00 | 18.08 | 30.56 | 20.84 | 3.72 |
| Pennsylvania | 19.30 | 15.04 | 15.28 | 25.73 | 17.55 | 3.70 |
| Ohio | 16.96 | 13.85 | 13.73 | 22.61 | 15.42 | 3.62 |
| Massachusetts | 30.48 | 25.06 | 25.59 | 40.64 | 27.71 | 3.49 |
| Tennessee | 13.18 | 11.84 | 12.16 | 17.57 | 11.98 | 3.18 |
| Oregon | 15.37 | 16.71 | 16.36 | 20.49 | 13.97 | 2.75 |
| Virginia | 15.28 | 16.79 | 16.88 | 20.37 | 13.89 | 2.65 |
| Arizona | 15.32 | 18.58 | 19.10 | 20.43 | 13.93 | 2.35 |
| Washington | 13.11 | 17.62 | 16.92 | 17.48 | 11.92 | 2.27 |
| Texas | 15.47 | 19.42 | 20.12 | 20.63 | 14.06 | 2.25 |
| Georgia | 14.73 | 20.42 | 20.83 | 19.64 | 13.39 | 2.07 |
| Florida | 15.24 | 25.48 | 26.19 | 20.32 | 13.85 | 1.71 |
Source: EIA Electric Power Monthly Table 5.6.B, February 2026 issue (2025 values preliminary), EIA average residential natural gas price by state and EIA heat content of natural gas. Costs are calculated from these figures for 19 selected states. States without a 2025 EIA gas price, Maine among them, are left out.
Michigan is the hardest case for a heat pump on running cost, and Florida the easiest. In Michigan the furnace is cheaper to run than both heat pumps in the table, and in Florida both heat pumps cost less than the furnace.
The American Gas Association, a gas industry trade group, finds gas cheaper in more places than this table does. Its January 2024 analysis says gas is cheaper to heat with in 41 out of 50 states when ENERGY STAR furnaces are set against ENERGY STAR heat pumps. NREL’s modeling of the whole housing stock found that 62% to 95% of households would see lower bills with a heat pump, but that count includes homes now heated with oil, propane and electric resistance.
For homes that burn gas, NREL’s lead author said that more than half would see a financial benefit, and the study’s median annual bill change for gas homes ranged from up $70 to down $380.
How much does a heat pump cost to install compared with a furnace?
Consumer Reports members surveyed in 2023 paid a median $8,348 to buy and install a heat pump, against $6,221 for a gas furnace.
| Measure | Heat pump | Gas furnace |
|---|---|---|
| Median price to buy and install, Consumer Reports members, 2023 ($) | 8,348 | 6,221 |
| Typical installed cost, AGA, low end ($) | 2,500 | 700 |
| Typical installed cost, AGA, high end ($) | 10,000 | 3,300 |
| Lifetime used in DOE documents (years) | 15 | 21.5 |
| Age at which ENERGY STAR says to consider replacing (years) | 10 | 15 |
Source: Consumer Reports, Heat Pump Buying Guide, updated March 2026, American Gas Association, January 2024, DOE FEMP, residential air-source heat pumps, DOE, consumer furnace standards rule and ENERGY STAR, when to replace.
The two sets of install prices agree on heat pumps and disagree on furnaces. The Consumer Reports median for a heat pump falls inside AGA’s range, and its gas furnace median sits well above AGA’s high end. The table names AGA because it’s a gas trade group.
A whole-home heat pump that replaces both the air conditioner and the heating system costs more. Rewiring America puts a whole-home install at $17,000 to $23,000. The range is for a 1,500 to 2,500 square foot home.
That figure covers two systems, so it isn’t a furnace-versus-heat-pump price.
The federal 25C credit paid up to $2,000 for a heat pump, and it’s not allowed on equipment placed in service after December 31, 2025. State and utility rebates aren’t covered here, so ask your installer which ones apply at your address.
Which lasts longer, a heat pump or a furnace?
A gas furnace lasts longer, on the estimates available. DOE estimates the average gas furnace lasts 21.5 years, while Consumer Reports says a heat pump generally wears out after 10 to 15 years.
DOE’s own cost model for air-source heat pumps assumes 15 years of life. None of these is a measured lifespan for heat pumps, so treat the gap as a planning range.
ENERGY STAR advises considering a replacement once a furnace is more than 15 years old and once a heat pump or air conditioner is more than 10.
How does a heat pump perform in cold weather?
DOE’s field tests of cold climate heat pumps found a median COP of 1.9 at 0 to 5°F. Across the temperature bins below 30°F the medians ranged from 1.6 to 2.7.
At that COP, heat from a heat pump costs about $26.69 per million Btu at the 2025 US average electricity price, against $15.59 for a 95% gas furnace. That figure is for one temperature bin in the field tests, so it isn’t a seasonal average.
EPA says air-source heat pumps are now more effective in colder climates, which it puts at 5°F and colder. The field tests used prototype cold climate units at a limited number of sites and left out periods with auxiliary heat or defrost, so your results depend on the model and the house.
Which one produces less CO2?
On the 2023 US average grid, a heat pump rated HSPF2 11 emits about 70 lb of CO2 per million Btu of delivered heat. A 95% gas furnace emits 123 lb per million Btu.
| eGRID subregion | Grid CO2 (lb per MWh) | Heat pump HSPF2 7.5 (lb CO2 per MMBtu delivered) | Heat pump HSPF2 11 (lb CO2 per MMBtu delivered) | Gas furnace 95% AFUE (lb CO2 per MMBtu delivered) |
|---|---|---|---|---|
| NPCC Upstate NY | 242.1 | 32 | 22 | 123 |
| WECC California | 428.5 | 57 | 39 | 123 |
| NPCC New England | 539.3 | 72 | 49 | 123 |
| RFC East | 596.9 | 80 | 54 | 123 |
| WECC Northwest | 631.7 | 84 | 57 | 123 |
| ERCOT All | 733.9 | 98 | 67 | 123 |
| FRCC All | 782.3 | 104 | 71 | 123 |
| RFC West | 911.4 | 122 | 83 | 123 |
| MRO West | 920.1 | 123 | 84 | 123 |
| RFC Michigan | 970.6 | 129 | 88 | 123 |
| WECC Rockies | 1036.6 | 138 | 94 | 123 |
| SERC Midwest | 1239.8 | 165 | 113 | 123 |
| MRO East | 1397.3 | 186 | 127 | 123 |
| U.S. average | 767.2 | 102 | 70 | 123 |
Source: EPA eGRID2023 summary tables and EPA Greenhouse Gas Equivalencies Calculator. Figures are calculated from grid CO2 and combustion CO2 only. The furnace figure is EPA’s 0.0053 metric tons of CO2 per therm, converted to pounds and divided by the 95% efficiency.
The grid you’re on changes the answer. A minimum-efficiency heat pump emits more than the furnace on four grids in the table, among them RFC Michigan and MRO East. A high-efficiency unit emits less than the furnace on every grid except MRO East.
The table is a snapshot of the 2023 grid average. NREL modeled heat pumps over a 16-year life with several future grid paths, and Canary Media reported emissions cuts in every one of the 48 contiguous states.
The same modeling put the average household cut at 36% to 64%. AGA says a gas home can have a footprint 19% lower than an ENERGY STAR heat pump home, and its page doesn’t give a method.
Heat pump vs air conditioner
A heat pump cools a house in summer the way an air conditioner does and heats it in winter, and ENERGY STAR says heat pumps also provide cooling in the summer months.
Under DOE’s 2023 standards a split-system heat pump must reach 14.3 SEER2, while a split-system air conditioner needs 13.4, or 14.3 in the Southeast and Southwest. EIA’s 2020 survey counted 82.69 million US homes with central air conditioning, a figure that includes central heat pumps, and 21.43 million with window or wall units.
| Year | Heat pumps | Gas furnaces | Central air conditioners |
|---|---|---|---|
| 2019 | 3,109,840 | 3,441,872 | 5,359,775 |
| 2020 | 3,418,478 | 3,351,176 | 5,910,284 |
| 2021 | 3,916,766 | 4,008,894 | 6,282,285 |
| 2022 | 4,334,479 | 3,872,368 | 6,053,575 |
| 2023 | 3,616,632 | 2,989,516 | 5,040,042 |
| 2024 | 4,122,004 | 3,120,677 | 5,559,766 |
| 2025 | 3,644,596 | 3,247,426 | 4,104,933 |
Source: AHRI, December 2020 statistical release, AHRI, December 2021 statistical release, AHRI, December 2023 statistical release and Contracting Business, AHRI’s December 2025 report. Units shipped by AHRI members each year.
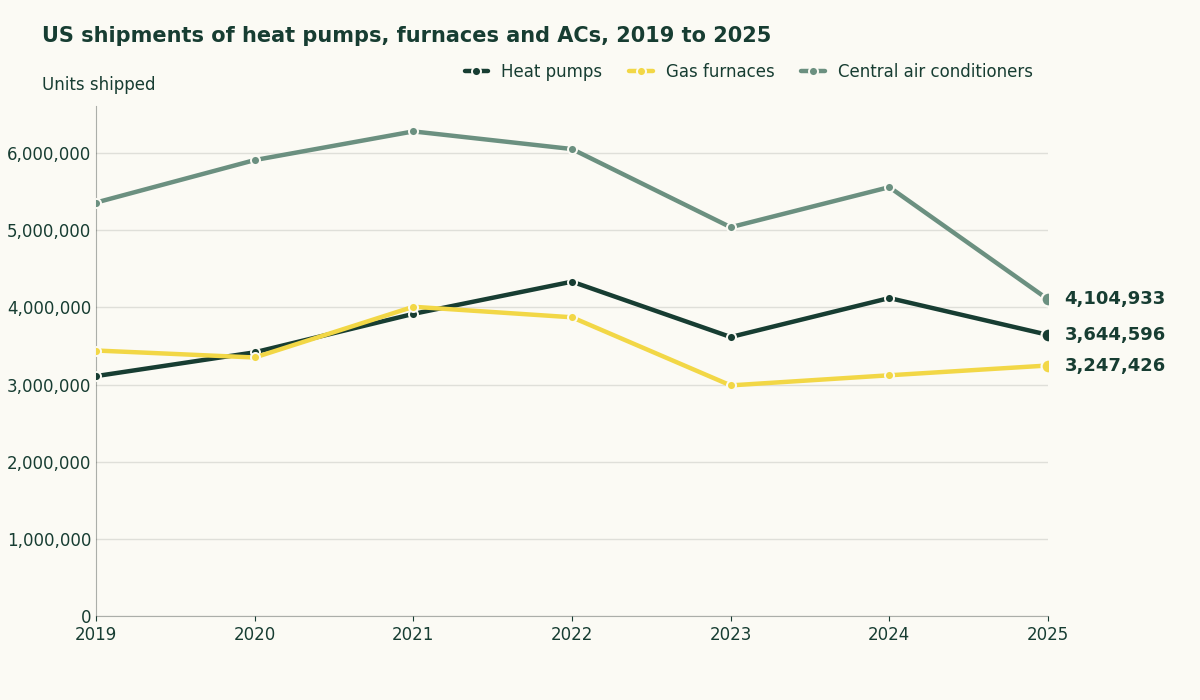
Heat pumps outsold gas furnaces in 2020 and in each year from 2022 to 2025, and trailed in 2019 and 2021, going by AHRI’s shipments. In 2025 heat pumps were 47% of cooling equipment sales, RMI reports.
If your air conditioner or furnace is the next thing to fail, ENERGY STAR says that in most zones a heat pump can be installed as a drop-in replacement for either one.
When does a dual-fuel heat pump and furnace make sense?
A dual-fuel system pairs a heat pump with a gas furnace and switches between them at a set outdoor temperature. NREL’s housing-stock model describes the switchover temperature or balance point, where the system stops the heat pump and starts the furnace.
In that model, adding a dual-fuel heat pump cut total site energy use across the US housing stock by 9.3%. That’s a saving in energy use, and the figure says nothing about dollars or emissions.
The cold-weather section shows the logic for the switch. At the field median COP, heat from a heat pump costs more per million Btu than heat from the gas furnace in the tables above, so the furnace takes over below the switchover temperature.
A Minnesota case study paired a cold climate heat pump with an existing 80% efficient gas furnace and found it cost-neutral against the furnace alone. A reduced electric rate helped, because it lets the utility switch the home to gas at peak times. The study also projected emissions to rise in year one and fall below the baseline over the equipment’s life.
DOE and Oak Ridge National Laboratory are developing a heat pump that can run at the same time as a gas furnace, but it’s an R&D project and not a product you can buy.
Where these numbers come from
The cost of delivered heat is calculated from EIA’s average residential prices. For gas, the price per thousand cubic feet is divided by the gas’s heat content, 1,036 Btu per cubic foot in the national history, and then by the furnace’s AFUE.
For heat pumps, the electricity price is multiplied by 293.08 kWh per million Btu, which is a million divided by 3,412 Btu per kWh, and then divided by the seasonal COP. State figures use EIA’s preliminary state electricity prices, and the emissions figures leave out upstream emissions and grid losses.
Your break-even COP before the next replacement
Your own bills settle it. Take the power rate in cents per kWh and the gas price from your bills, and work out the COP at which the two costs match. A heat pump whose seasonal COP is above that number costs less to run than your furnace at those prices.
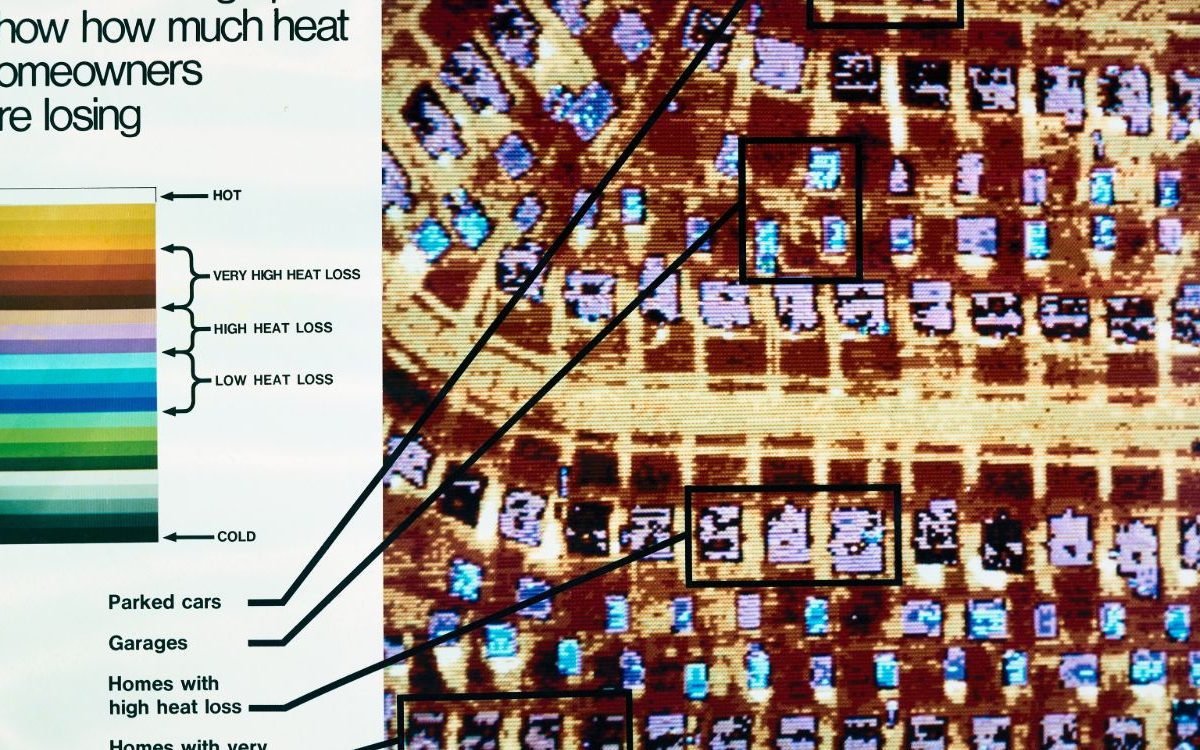
Where your house loses heat matters too, and the page on how homes lose heat walks through the leaks. The page on US energy waste by sector breaks down where it goes, and the page on what a geothermal heat pump costs covers ground-source systems.
When your furnace or air conditioner fails, get one quote for a gas furnace and one for a heat pump. Then compare each heat pump’s seasonal COP, which the running-cost section shows how to work out from its efficiency rating, with your break-even COP.
Top photo: Tony Webster, CC BY 4.0, via Wikimedia Commons, cropped.