Climate change has put about 90% of the excess heat in the Earth system into the ocean, and that heat is raising seas and bleaching coral. Satellites show sea level up 111 millimeters between 1993 and 2023, and NOAA says heat stress hit 84% of the world’s coral reef area from early 2023 to mid-2025.
Top ocean climate change statistics
- Copernicus says the global ocean has absorbed about 90% of the excess heat from human-induced emissions, and its heat content hit a record in 2025.
- The upper 2,000 meters of the ocean gained about 23 zettajoules of heat in 2025, a record, according to a study in Advances in Atmospheric Sciences.
- WMO reports that global sea level rose 4.75 millimeters a year from 2012 to 2025, against 2.65 a year from 1993 to 2011.
- Stockholm University’s summary of the Planetary Health Check says ocean surface pH has fallen about 0.1 units since the industrial era.
- Marine heatwaves reached 89% of the global ocean in 2025, Copernicus Marine reports.
- NOAA’s Coral Reef Watch counts 84.4% of reef area under bleaching-level heat stress from January 2023 to September 2025.
- IUCN reports that the ocean’s oxygen content is down around 2% since the middle of the 20th century.
- NOAA projects US coasts will see 10 to 12 more inches of sea level rise by 2050.
How is climate change affecting the ocean?
The ocean took up 29% of human CO2 emissions in 2015 to 2024, the Global Carbon Budget estimates, and it has absorbed most of the heat those emissions trap.
Burning fossil fuels sets this off. The causes of global warming are broken down by gas and sector on their own page, and the page on greenhouse gas emissions by country shows who emits what.
The ocean is one of several places the warming shows up, and the evidence for global warming in the air, on land and in the ice sits on its own page.
How much heat has the ocean absorbed?
Upper-ocean heat content hit a record in 2025 for the fifth year running in NOAA’s 0 to 700 meter series.
Down to 2,000 meters, the ocean gained 23 zettajoules in 2025 against 16 in 2024. Carbon Brief puts that 2025 gain at 39 times all annual human energy use. The study behind the estimate gives a margin of plus or minus 8 zettajoules, so read the 23 as a best estimate.
WMO reports that heat content reached its highest level in the 66-year record in 2025, with the 2005 to 2025 warming rate more than twice the 1960 to 2005 rate.
| Year | 0 to 700 m (ZJ) | 0 to 2,000 m (ZJ) |
|---|---|---|
| 2005 | 84.12 | 101.71 |
| 2006 | 104.30 | 126.38 |
| 2007 | 94.78 | 123.94 |
| 2008 | 100.52 | 132.57 |
| 2009 | 101.26 | 134.31 |
| 2010 | 103.67 | 145.37 |
| 2011 | 108.69 | 153.94 |
| 2012 | 109.41 | 161.87 |
| 2013 | 126.01 | 186.50 |
| 2014 | 132.61 | 201.10 |
| 2015 | 151.22 | 224.01 |
| 2016 | 139.72 | 207.99 |
| 2017 | 158.78 | 235.89 |
| 2018 | 167.22 | 240.59 |
| 2019 | 177.26 | 254.36 |
| 2020 | 175.24 | 255.25 |
| 2021 | 187.35 | 272.80 |
| 2022 | 196.87 | 281.92 |
| 2023 | 207.32 | 292.20 |
| 2024 | 214.69 | 303.16 |
| 2025 | 228.45 | 325.33 |
Source: NOAA NCEI, Global Ocean Heat Content yearly time series, converted from NOAA’s 10^22 joule units to zettajoules. NOAA measures its 0 to 700 meter series against the 1955 to 2006 average.
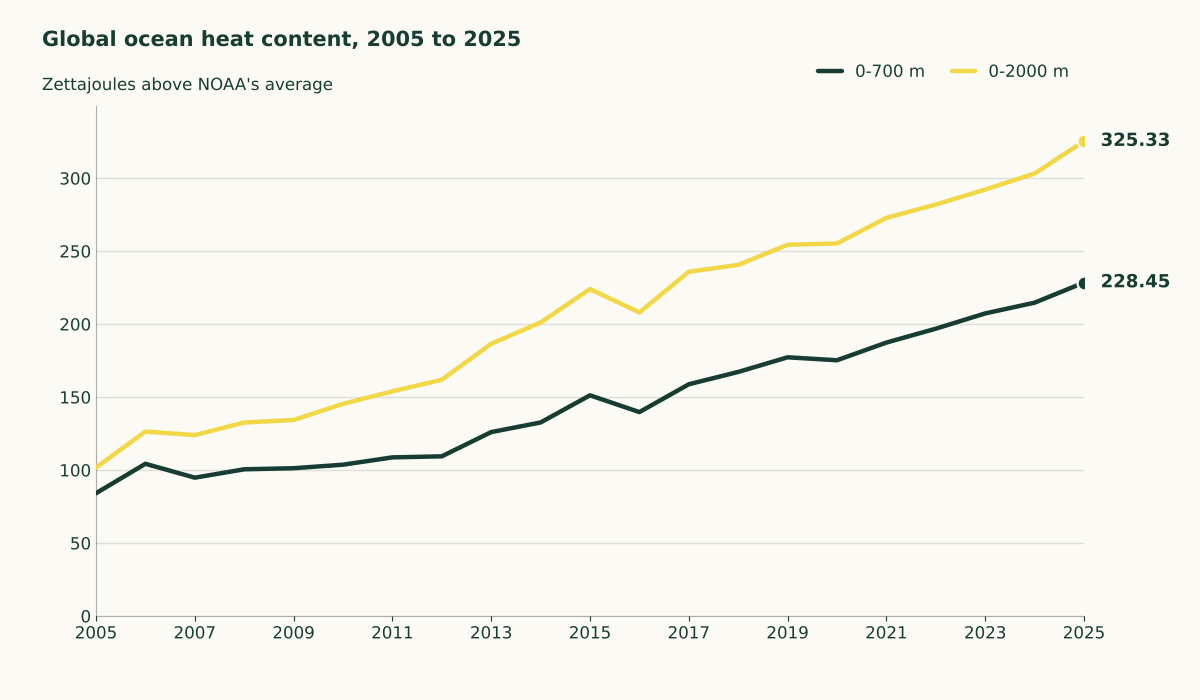
NOAA’s file puts the 0 to 2,000 meter layer’s gain from 2005 to 2025 at 223.62 zettajoules, computed from its end values. Sea surface temperature slipped to the third warmest since 1993 in 2025, yet the upper 2,000 meters still set a record.
How fast is sea level rising?
Global sea level rose 111 millimeters between 1993 and 2023, and the yearly rate has roughly doubled since satellites began measuring it. Each source below reports its own dataset and window, so the rates don’t line up row for row. Each pair of rows from one source shows a faster rate in the later window.
| Source | Period | Rate (mm per year) |
|---|---|---|
| IPCC | 1901 to 1990 | 1.4 |
| IPCC | 2006 to 2015 | 3.6 |
| WMO | 1993 to 2011 | 2.65 |
| WMO | 2012 to 2025 | 4.75 |
| Copernicus | 1999 to 2009 | 2.9 |
| Copernicus | 2015 to 2025 | 3.8 |
| Hamlington et al. | 1993 | 2.1 |
| Hamlington et al. | 2023 | 4.5 |
| NASA JPL | 2024 | 5.9 |
Source: IPCC Special Report on the Ocean and Cryosphere, WMO State of the Global Climate 2025, Copernicus European State of the Climate 2025, Hamlington and colleagues in Communications Earth & Environment and NASA JPL. The Hamlington rows are rates for single years, and the 5.9 for NASA JPL is its 0.59 centimeters a year, converted.
Ice melt is the bigger driver over the long run. Copernicus attributes about 60% of the rise since 1999 to melting ice and about 30% to warming seawater expanding, and NASA puts expansion at about one-third of modern sea level rise. In 2024 the split flipped, and JPL attributes two-thirds of that year’s rise to thermal expansion.
| Year | Sea level anomaly (mm) |
|---|---|
| 2000 | 0.7 |
| 2001 | 6.0 |
| 2002 | 7.6 |
| 2003 | 10.9 |
| 2004 | 12.5 |
| 2005 | 15.7 |
| 2006 | 18.2 |
| 2007 | 18.1 |
| 2008 | 22.2 |
| 2009 | 25.7 |
| 2010 | 27.1 |
| 2011 | 25.5 |
| 2012 | 35.8 |
| 2013 | 38.2 |
| 2014 | 41.0 |
| 2015 | 49.7 |
| 2016 | 52.9 |
| 2017 | 53.8 |
| 2018 | 56.6 |
| 2019 | 63.0 |
| 2020 | 65.7 |
| 2021 | 70.1 |
| 2022 | 72.7 |
| 2023 | 78.5 |
| 2024 | 81.9 |
Source: NOAA Laboratory for Satellite Altimetry global mean sea level file. Each value is the average of that year’s satellite readings, computed from the file, measured against the file’s own reference level.
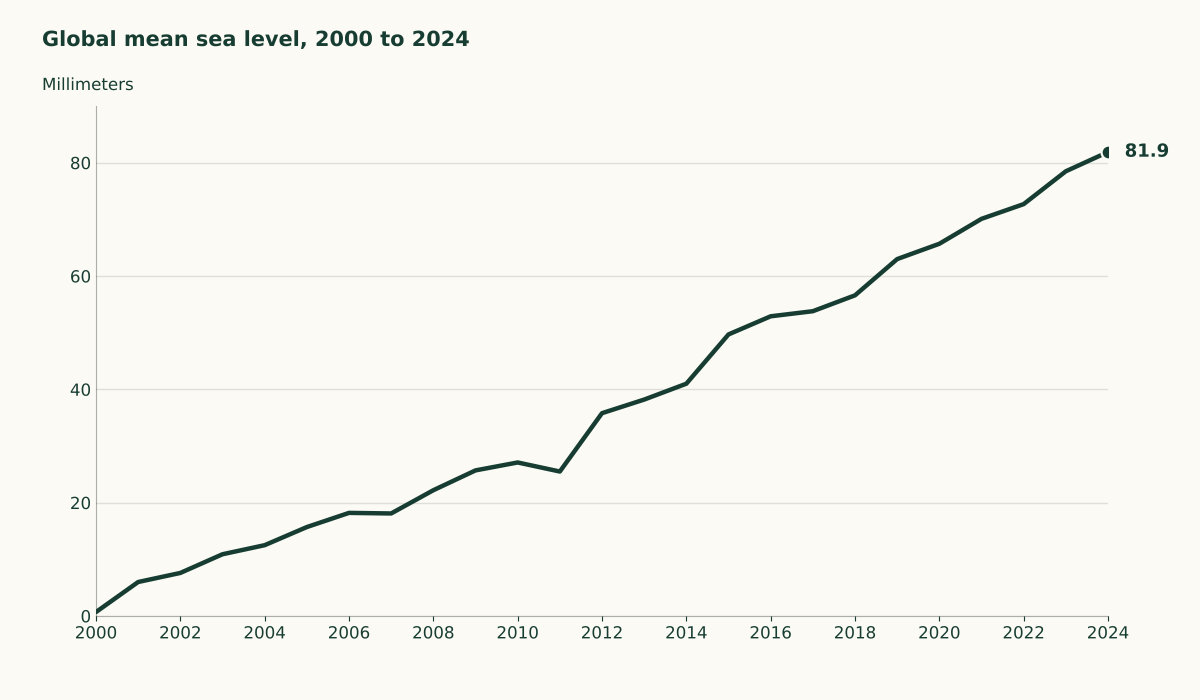
NOAA’s file shows a long-run trend of 3.11 millimeters a year with no glacial isostatic adjustment applied. NASA’s average for the satellite record is about 3.3 millimeters a year, a little higher.
Is the ocean getting more acidic?
Yes. The ocean absorbs about 30% of the carbon dioxide released into the air, and NOAA says ocean acidification is the drop in pH that follows from taking it up.
Stockholm University’s write-up of the Planetary Health Check says surface pH has fallen about 0.1 units since the industrial era, a rise in acidity of 30% to 40%. The same review judged the ocean acidification boundary breached for the first time in 2025, one of seven of nine planetary boundaries now exceeded.
How common are marine heatwaves?
At least 89% of the global ocean had a marine heatwave in 2025, Copernicus Marine reports, and 55% had intense ones, rated strong or higher.
The IPCC found in 2019 that marine heatwaves had very likely doubled in frequency since 1982.
How much coral has bleached?
Coral Reef Watch puts bleaching-level heat stress at about 84.4% of the world’s coral reef area from January 2023 to September 2025, against 68.2% in 2014 to 2017. NOAA says mass bleaching was documented in at least 83 countries and territories.
The International Coral Reef Initiative announced the 84% figure on April 23, 2025. The same AP report, carried by NBC News, notes that about 25% of all marine species live in, on and around coral reefs.
| Global event | Years | Reef area under bleaching-level heat stress (%) |
|---|---|---|
| First | 1998 | 21 |
| Second | 2010 | 37 |
| Third | 2014 to 2017 | 68.2 |
| Fourth | 2023 to 2025 | 84.4 |
Source: NOAA Coral Reef Watch for the third and fourth events and the Global Coral Reef Monitoring Network, which reports NOAA’s figures, for the first and second.
Each global event has hit a bigger share of reef than the one before it. NOAA’s experts concluded that the fourth event likely ended in mid-2025, and “We are now in the era where reefs will bleach on a near-annual basis,” said Derek Manzello, coordinator of NOAA’s Coral Reef Watch. If you’re planning a reef trip, bleaching is a live risk for whichever reef you pick.
Is the ocean running out of oxygen?
The ocean isn’t running out of oxygen, but it is losing some. The open ocean lost 0.5% to 3.3% of its oxygen over the upper 1,000 meters between 1970 and 2010, by the IPCC’s very likely range.
IUCN’s review puts the loss at around 2% since the middle of the 20th century and says the volume of ocean water with no oxygen at all has quadrupled since the 1960s. IUCN expects ocean oxygen to fall 3% to 4% by 2100 under a business-as-usual emissions scenario. The IPCC and IUCN figures cover different periods, so they’re separate estimates.
What does a warming ocean mean for fish and fishing?
The IPCC projects that the maximum catch potential of fisheries will fall 20.5% to 24.1% by the end of this century, compared with 1986 to 2005, under its highest-emissions scenario. Under its low-emissions scenario, the IPCC projects those changes to be three to four times smaller.
In the eastern Bering Sea, an estimated 10 billion snow crabs disappeared between 2018 and 2021, and a study in Science found that a marine heat wave probably set off a mass die-off, partly through starvation. Alaska’s snow crab revenue fell from about $150 million a year to around $24 million in the 2021 to 2022 season, and the 2022 to 2023 season was shut.
FAO’s 2026 report puts 62.4% of assessed fish stocks at biologically sustainable levels, down from 64.5% two years earlier. The MSC files that figure under overfishing, so it isn’t a climate number. Fishing is also a living for many people, and the MSC’s summary of the FAO report says more than 600 million people depend on aquatic food resources for their livelihoods.
How much more high-tide flooding will US coasts get?
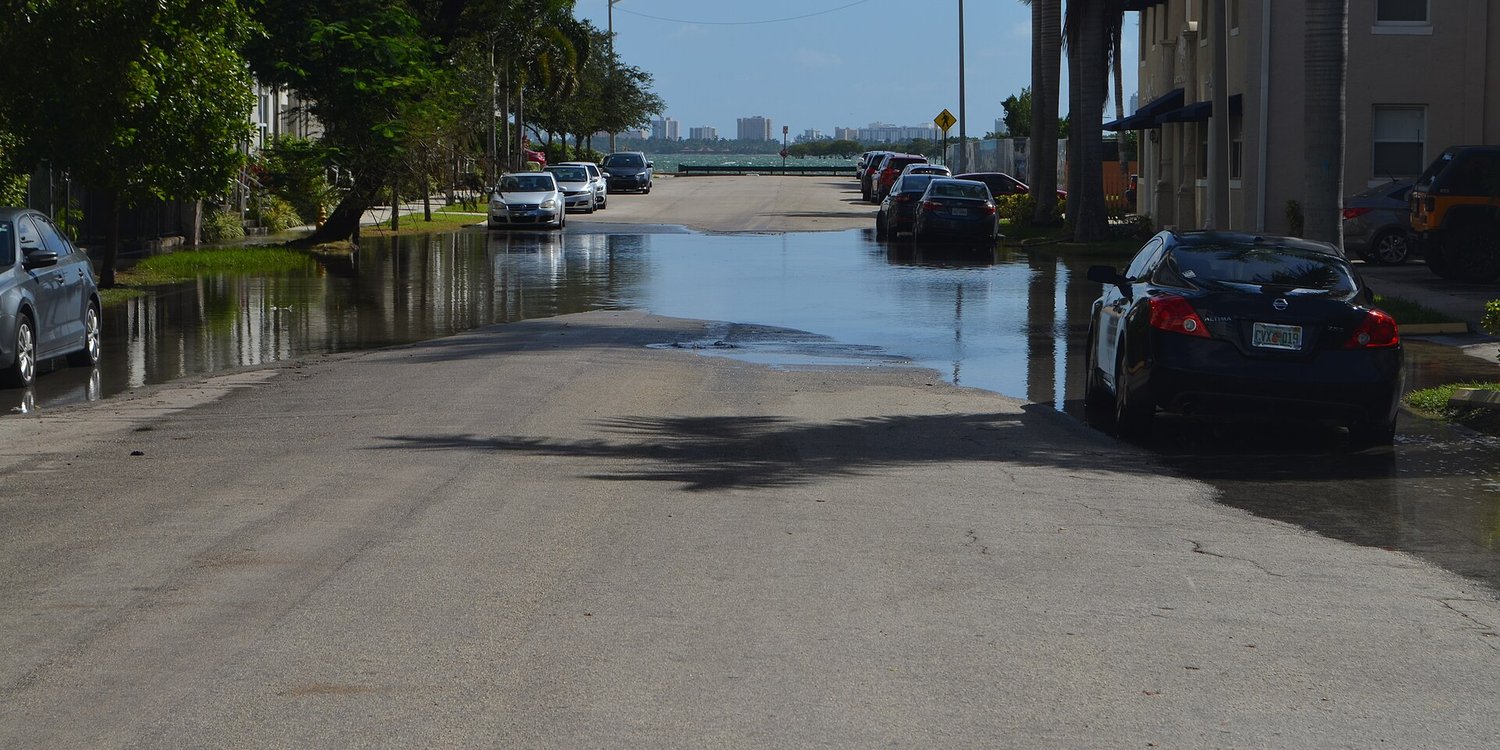
With El Niño conditions returning, NOAA forecasts a record national median of 7 to 12 high-tide flood days for May 2026 to April 2027, up more than 250% from 2000.
NOAA’s 2024-25 outlook looked back at the 2023 to 2024 flood year, and 34 stations met or exceeded their records, up from 8 the year before. The Mid-Atlantic had the greatest regional median that year, 17 days, which NOAA ties to high sea level rise rates and strong El Niño influences.
| Region | Forecast flood days, May 2026 to April 2027 | Extra days a year versus 2000 |
|---|---|---|
| United States (median) | 7 to 12 | 7 |
| Northeast | 5 to 11 | 5 |
| Mid-Atlantic | 15 to 20 | 14 |
| East Gulf Coast | 2 to 7 | 3 |
| West Gulf Coast | 4 to 14 | 9 |
| Southwest | 3 to 6 | 3 |
| Northwest | 7 to 18 | 7 |
Source: NOAA CO-OPS Annual High Tide Flooding Outlook. NOAA gives a median for some regions and an average for others in the last column, and the page gives no region-wide range for the Southeast.
If you live on the Mid-Atlantic coast, your region leads the forecast in the table. NOAA’s 2022 report projects 10 to 12 more inches of sea level rise along the US coastline by 2050, about as much as the last century, and says the rise brings more coastal flooding even without heavy rain or storms. How much of that your town gets varies mainly with changes in land height.
Where these numbers come from
The heat table multiplies NOAA’s values by 10 to turn its 10^22 joule units into zettajoules. The sea level table averages every satellite reading in each calendar year from NOAA’s file, which ends in February 2025, so 2025 is left out. The rate table quotes each source’s own window and adjusts nothing. The flood table copies NOAA’s forecast ranges and leaves out the Southeast.
The ocean carbon sink that stopped growing
The ocean’s carbon sink averaged 3.2 gigatonnes of carbon a year, plus or minus 0.4, over 2015 to 2024. The Global Carbon Project says that sink has been relatively stagnant since 2016, largely because of climate variability and ocean heatwaves. The Global Carbon Budget 2025 paper adds that the sink was further hit by the ocean heatwave of 2023 to 2024 in the Northern Hemisphere.
The page on ways to stop global warming covers what cuts emissions, and the page on offshore wind farms tracks the turbines going up at sea. To see what your own coast is facing, NOAA’s outlook lets you pick the tide station nearest you.