Burning fossil fuels and other human activity cause climate change, and the Indicators of Global Climate Change 2025 update puts the human-induced warming at 1.37°C in 2025, measured against 1850 to 1900. That activity adds carbon dioxide and other greenhouse gases to the air, and those gases trap heat. The figures come from agencies and research groups such as NOAA and the IPCC, and each one gives its year.
Top climate change cause statistics
- The IPCC puts human-caused warming at about 1.07°C between the 1850 to 1900 average and 2010 to 2019.
- Scripps measured carbon dioxide at Mauna Loa at 432.00 ppm in May 2026, 1.8 ppm above May 2025.
- The world emitted 54.1 billion tonnes of CO2 equivalent in 2025, up 0.7%, counting every greenhouse gas but leaving out land use.
- The Global Carbon Project projects a record 38.1 billion tonnes of fossil CO2 in 2025.
- Electricity and heat made 29.2% of 2025 emissions, ahead of transport at 16.2%, in EDGAR’s sector totals.
- Carbon dioxide in the air rose 3.5 ppm from 2023 to 2024, the biggest one-year jump since modern measurements began in 1957.
- NASA’s satellite measurements of sunlight, which start in 1978, show no upward trend.
- Volcanoes release less than 1 billion tonnes of CO2 a year, against more than 35 billion from fossil fuels and cement.
What causes climate change?
Human activity causes it, and the Met Office names burning fossil fuels as the main cause. The IPCC’s sixth assessment says it’s unequivocal that human influence has warmed the atmosphere, ocean and land, and it finds that carbon dioxide is up 47% since 1750 as of 2019.
EPA says carbon dioxide enters the air through burning fossil fuels and biological materials such as trees, and through chemical reactions such as cement making. To see where these fuels come from, read how fossil fuels formed.
NASA’s consensus page quotes the American Association for the Advancement of Science saying that about 97% of climate scientists have concluded that human-caused climate change is happening. The page on the evidence of human-caused climate change lays out the full case.
How does the greenhouse effect work?
Think of a blanket. The Met Office describes greenhouse gases as a warming blanket around the Earth. Sunlight passes through the air and warms the ground, the ground gives off infrared heat, and the gases catch some of that heat on its way to space.
NASA says about 90% of that heat is absorbed by greenhouse gases and re-radiated, which slows its loss to space. Without the blanket Earth would be about 30 degrees colder, and with it the planet holds an average of 15°C.
Burning fossil fuels adds more of those gases, which thickens the blanket.
Which greenhouse gases cause climate change?
Carbon dioxide made 73.8% of 2025 emissions and about two thirds of the heating from long-lived greenhouse gases in 2024, 2.333 of the 3.539 watts per square meter in NOAA’s table.
| Gas | Share of emissions 2025 (%) | Share of heating 2024 (%) |
|---|---|---|
| Carbon dioxide | 73.8 | 65.9 |
| Methane | 17.6 | 16.0 |
| Nitrous oxide | 5.3 | 6.4 |
| Fluorinated gases and CFCs | 3.3 | 11.7 |
Source: EDGAR 2026 report for emissions and NOAA’s Annual Greenhouse Gas Index table for heating. Emissions are in CO2 equivalent at 100-year warming potentials and leave out land use. Heating is each gas’s share of NOAA’s 2024 radiative forcing, and its F-gas row also counts CFCs and HCFCs, so that row isn’t like for like.
A third measure comes from a model by Jones and colleagues, shown by Our World in Data. It puts the warming from cumulative emissions through 2024 at 1.22°C for carbon dioxide and 0.38°C for methane. The model leaves out cooling from sulfur dioxide and aerosols, so net warming can be lower than its three-gas total of 1.68°C. Dividing the file’s source columns shows that 62.6% of that total comes from fossil fuels and industry, and 37.4% from agriculture and land use.
Methane comes next. About 65% of methane emissions come from direct human sources, by the Global Methane Budget’s count for 2010 to 2019. Over 100 years a tonne of it warms 27 to 30 times as much as a tonne of CO2, though it lasts about a decade. For the oil and gas side, see methane released by oil and gas operations.
Nitrous oxide traps 273 times as much heat as carbon dioxide over 100 years and stays in the air for more than a century. Human emissions rose 40% from 1980 to 2020, mostly from farming.
Synthetic gases such as hydrofluorocarbons and sulfur hexafluoride are powerful greenhouse gases, with warming potentials in the thousands or tens of thousands.
Water vapor is the most abundant greenhouse gas, but NASA says it is not a direct cause of climate change, since a warming ocean puts more of it into the air.
How much has carbon dioxide in the air risen?
Carbon dioxide at Mauna Loa averaged 427.35 ppm in 2025, up from 315.98 ppm in 1959. That’s a rise of about 35%, worked out from NOAA’s two annual values. The global marine surface average was 425.62 ppm in 2025.
| Year | Mauna Loa (ppm) | Global average (ppm) |
|---|---|---|
| 2001 | 371.32 | 370.57 |
| 2002 | 373.45 | 372.58 |
| 2003 | 375.98 | 375.14 |
| 2004 | 377.70 | 376.95 |
| 2005 | 379.98 | 378.98 |
| 2006 | 382.09 | 381.15 |
| 2007 | 384.02 | 382.90 |
| 2008 | 385.83 | 385.02 |
| 2009 | 387.64 | 386.50 |
| 2010 | 390.10 | 388.75 |
| 2011 | 391.85 | 390.62 |
| 2012 | 394.06 | 392.65 |
| 2013 | 396.74 | 395.40 |
| 2014 | 398.81 | 397.34 |
| 2015 | 401.01 | 399.65 |
| 2016 | 404.41 | 403.07 |
| 2017 | 406.76 | 405.22 |
| 2018 | 408.72 | 407.61 |
| 2019 | 411.65 | 410.07 |
| 2020 | 414.21 | 412.45 |
| 2021 | 416.41 | 414.70 |
| 2022 | 418.53 | 417.08 |
| 2023 | 421.08 | 419.35 |
| 2024 | 424.61 | 422.79 |
| 2025 | 427.35 | 425.62 |
Source: NOAA, Mauna Loa annual mean and NOAA, global annual mean. Values for 2025 are preliminary, and Mauna Loa readings from December 2022 to July 2023 come from a site at the Maunakea Observatories after the Mauna Loa eruption.
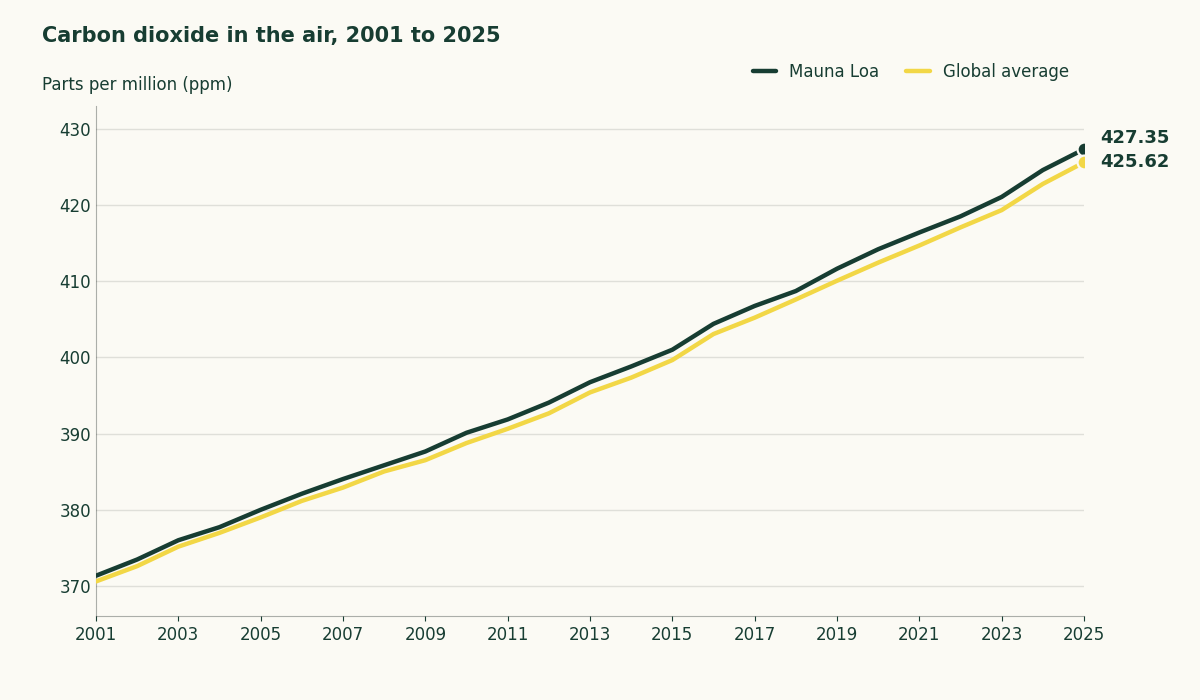
Before 1850, carbon dioxide sat between about 270 and 280 ppm for thousands of years. The Global Carbon Budget puts 2025 at 425.6 ppm, 53% above the pre-industrial level of around 278 ppm. NASA says human activity has raised the level by nearly 50% since 1750.
The rise is speeding up. NOAA measured a record-breaking 3.72 ppm increase from January 2024 to January 2025, while the WMO’s figure for 2023 to 2024 was lower, and the two come from different measurement networks. The WMO says growth has tripled since the 1960s, from 0.8 to 2.4 ppm a year in 2011 to 2020.
Where do greenhouse gas emissions come from?
Making electricity and heat leads the list. EPA says burning fossil fuels for it is the largest single source of global greenhouse gas emissions, at 34% of the world total in 2019.
| Sector | 1990 (Gt CO2e) | 2025 (Gt CO2e) | Share of 2025 (%) | Change since 1990 (%) |
|---|---|---|---|---|
| Electricity and heat | 7.68 | 15.81 | 29.2 | 106 |
| Transport | 4.71 | 8.77 | 16.2 | 86 |
| Agriculture | 5.00 | 6.32 | 11.7 | 26 |
| Industry (fuel burned) | 3.97 | 6.25 | 11.5 | 58 |
| Fuel production | 3.95 | 6.11 | 11.3 | 55 |
| Industrial processes | 1.97 | 5.38 | 9.9 | 172 |
| Buildings | 3.72 | 3.57 | 6.6 | −4 |
| Waste | 1.15 | 1.94 | 3.6 | 69 |
Source: European Commission, EDGAR 2026 workbook, summing its global rows for each sector. Shares and changes are calculated from those sums. The totals count fossil CO2, methane, nitrous oxide and F-gases at 100-year warming potentials and leave out land use.
Electricity and heat more than doubled between 1990 and 2025, and industrial processes such as cement and steel nearly tripled. Buildings shrank while the other seven sectors grew.
If you burn gas or oil at your own address, that fuel sits in the buildings row, and the electricity you buy sits in the electricity row. The IPCC’s 2019 count, which assigns electricity to the buildings that use it, lifts buildings from 6% to 16% of emissions. The same report puts energy supply at 34% of 2019 emissions, a bigger slice than EDGAR’s 29.2% for 2025. The years and sector definitions differ, and the IPCC’s total includes land use.
Almost all of the world’s transport energy, 95%, comes from petroleum-based fuels, largely gasoline and diesel. If you drive a gasoline or diesel car, your fuel is part of that figure.
Agriculture and land use, forestry included, were 22% of 2019 emissions, mostly farming and deforestation. EDGAR’s agriculture row leaves out land use.
On coal’s part in the power mix, see how coal use has changed, and for the policies that attach a cost to emissions, see putting a price on carbon.
How much of climate change comes from cutting down forests?
The sources disagree on land use. The 2025 carbon budget projects land-use emissions such as deforestation at 4.1 billion tonnes of CO2 in 2025, on top of the 38.1 billion tonnes of fossil CO2 that CSIRO also reports.
EDGAR’s workbook has deforestation releasing 3.67 billion tonnes in 2025, or a net 0.88 billion after forests absorb some. The IPCC’s 2019 inventory put net land-use CO2 at 6.6 billion tonnes, give or take 4.6.
The IPCC figure is for 2019 and the other two are for 2025, and the three come from separate teams. EDGAR’s net total is small because forests absorb carbon, and the Global Carbon Budget calls the uncertainty in land-use emissions persistent and large.
How much warming does each cause account for?
The IPCC’s ranges for 2010 to 2019 split the warming by cause. Well-mixed greenhouse gases added 1.0°C to 2.0°C of warming, while aerosols and other human drivers took away up to 0.8°C. All human causes combined come to 0.8°C to 1.3°C, and the range for natural drivers straddles zero, so they add little to the net warming.
| Driver | Low (°C) | High (°C) |
|---|---|---|
| Well-mixed greenhouse gases | 1.0 | 2.0 |
| Aerosols and other human drivers | −0.8 | 0.0 |
| Natural drivers | −0.1 | 0.1 |
| Internal variability | −0.2 | 0.2 |
| All human causes combined | 0.8 | 1.3 |
Source: IPCC, Climate Change 2021 Summary for Policymakers. Ranges are the IPCC’s “likely” ranges for 2010 to 2019 against 1850 to 1900, and aerosols appear as a negative contribution because they cool.
The same update says that for 2016 to 2025 observed warming averaged 1.26°C, of which 1.24°C was human-induced. It also finds that greenhouse gas emissions averaged an all-time high of 54.6 billion tonnes of CO2 equivalent a year over 2015 to 2024.
Do the Sun, volcanoes or orbital cycles cause climate change?
No. The IPCC’s table of drivers puts the Sun’s effect since 1750 at 0.01 watts per square meter, against 2.72 for all human causes together. NASA’s satellite measurements show no upward trend in sunlight either.
| Driver | Forcing 1750 to 2019 (W/m2) |
|---|---|
| Carbon dioxide | 2.16 |
| Methane | 0.54 |
| Tropospheric ozone | 0.47 |
| Halogenated gases | 0.41 |
| Nitrous oxide | 0.21 |
| Solar irradiance | 0.01 |
| Land use | −0.20 |
| Aerosols (net) | −1.06 |
Source: IPCC, Climate Change 2021 Chapter 7, Table 7.8, effective radiative forcing for 1750 to 2019. The aerosol row adds the table’s aerosol-radiation and aerosol-cloud rows. Volcanic forcing is left out of the IPCC table because eruptions are episodic.
Volcanoes emit less than 1 billion tonnes of CO2 a year, a small fraction of the human total. Several US states emit more CO2 in a year than all the volcanoes on the planet combined.
Orbital cycles work on timescales of tens of thousands of years. NASA lists cycles of about 100,000 years for the shape of Earth’s orbit and 41,000 years for its tilt, and says they are responsible for triggering the beginning and end of glaciation periods.
Human-made aerosols cool the air, so they carry a negative number in the table. The chapter’s summary gives minus 1.3 for 1750 to 2014, a different span from the table’s.
How we put these numbers together
The sector table sums the global rows of EDGAR’s 2026 workbook, and the heating shares divide each gas’s 2024 forcing in NOAA’s table by NOAA’s total. Sources count differently, so the same year can carry two values. The WMO’s bulletin of 16 October 2025 gives 423.9 ppm for 2024 on its own network, and NOAA’s global figure runs lower.
We update this page when NOAA posts new Mauna Loa data and when the WMO or the Global Carbon Project issues a new report. The Global Carbon Project’s 2025 budget came out on 13 November 2025.
Why your car and your power supply are the sources closest to home
In the US, transportation is the largest source of direct greenhouse gas emissions, by EPA’s inventory for 2022. If you pay an electric bill there, 60% of the power behind it came from burning fossil fuels in that year, mostly coal and natural gas.
How fast electric cars are catching on and the types of renewable energy show what switching looks like in numbers. To find your own share, start with your fuel receipts and your power bill, the two places where those sources show up on paper.