The average US home paid 18.31 cents per kWh for electricity in July 2026, and Hawaii was the most expensive state at 48.00 cents. Prices vary widely by state, so the table below ranks every state and DC by its July 2026 price and shows the price a year earlier and the change.
Cost of electricity per kWh by state, ranked
The ranking uses EIA’s Electric Power Monthly estimate of the average residential price in July 2026. EIA calculates the price by dividing revenue by sales, so it includes taxes and fees, and EIA calls the July values preliminary. Prices are usually highest in the summer, so a July figure runs above a yearly average. The table is refreshed after each EIA release, and the next one, with August data, is scheduled for October 23, 2026.
The table is ordered by price, with the US average in the last row.
| Rank | State | July 2026 (cents/kWh) | July 2025 (cents/kWh) | Change (cents) | Change (%) |
|---|---|---|---|---|---|
| 1 | Hawaii | 48.00 | 39.36 | +8.64 | +22.0 |
| 2 | California | 33.61 | 32.66 | +0.95 | +2.9 |
| 3 | Maine | 32.41 | 27.98 | +4.43 | +15.8 |
| 4 | Massachusetts | 30.49 | 30.07 | +0.42 | +1.4 |
| 5 | New York | 29.90 | 26.22 | +3.68 | +14.0 |
| 6 | Alaska | 28.83 | 27.30 | +1.53 | +5.6 |
| 7 | Rhode Island | 28.29 | 26.18 | +2.11 | +8.1 |
| 8 | New Hampshire | 26.60 | 22.79 | +3.81 | +16.7 |
| 9 | District of Columbia | 25.21 | 23.04 | +2.17 | +9.4 |
| 10 | New Jersey | 25.19 | 25.32 | -0.13 | -0.5 |
| 11 | Connecticut | 24.16 | 27.60 | -3.44 | -12.5 |
| 12 | Vermont | 23.75 | 22.14 | +1.61 | +7.3 |
| 13 | Michigan | 23.05 | 20.55 | +2.50 | +12.2 |
| 14 | Pennsylvania | 21.72 | 19.51 | +2.21 | +11.3 |
| 15 | Maryland | 21.41 | 18.83 | +2.58 | +13.7 |
| 16 | Ohio | 19.45 | 17.38 | +2.07 | +11.9 |
| 17 | Illinois | 19.22 | 17.22 | +2.00 | +11.6 |
| 18 | Wisconsin | 19.06 | 18.25 | +0.81 | +4.4 |
| 19 | Delaware | 18.48 | 16.58 | +1.90 | +11.5 |
| 20 | Virginia | 17.55 | 15.78 | +1.77 | +11.2 |
| 21 | Minnesota | 17.45 | 16.92 | +0.53 | +3.1 |
| 22 | Colorado | 17.00 | 15.99 | +1.01 | +6.3 |
| 23 | Indiana | 16.73 | 16.18 | +0.55 | +3.4 |
| 24 | Alabama | 16.40 | 15.93 | +0.47 | +3.0 |
| 25 | Georgia | 16.27 | 15.56 | +0.71 | +4.6 |
| T-26 | Missouri | 16.09 | 15.56 | +0.53 | +3.4 |
| T-26 | New Mexico | 16.09 | 15.80 | +0.29 | +1.8 |
| 28 | Iowa | 15.99 | 15.31 | +0.68 | +4.4 |
| 29 | Oregon | 15.97 | 15.61 | +0.36 | +2.3 |
| 30 | Texas | 15.88 | 15.36 | +0.52 | +3.4 |
| 31 | West Virginia | 15.78 | 15.43 | +0.35 | +2.3 |
| 32 | South Carolina | 15.47 | 14.70 | +0.77 | +5.2 |
| 33 | Arizona | 15.38 | 15.34 | +0.04 | +0.3 |
| 34 | South Dakota | 15.37 | 14.52 | +0.85 | +5.9 |
| 35 | Kansas | 15.27 | 14.46 | +0.81 | +5.6 |
| 36 | North Carolina | 15.16 | 13.37 | +1.79 | +13.4 |
| 37 | Florida | 15.03 | 15.11 | -0.08 | -0.5 |
| 38 | Montana | 14.99 | 14.27 | +0.72 | +5.0 |
| 39 | Washington | 14.71 | 13.45 | +1.26 | +9.4 |
| 40 | Mississippi | 14.54 | 13.58 | +0.96 | +7.1 |
| 41 | Wyoming | 14.36 | 14.64 | -0.28 | -1.9 |
| 42 | Oklahoma | 14.35 | 13.52 | +0.83 | +6.1 |
| 43 | Arkansas | 14.33 | 13.26 | +1.07 | +8.1 |
| 44 | Kentucky | 13.81 | 13.13 | +0.68 | +5.2 |
| 45 | Nebraska | 13.78 | 12.84 | +0.94 | +7.3 |
| 46 | Idaho | 13.73 | 12.28 | +1.45 | +11.8 |
| 47 | Tennessee | 13.71 | 13.21 | +0.50 | +3.8 |
| 48 | North Dakota | 13.41 | 13.31 | +0.10 | +0.8 |
| 49 | Utah | 13.12 | 13.45 | -0.33 | -2.5 |
| 50 | Nevada | 12.77 | 12.39 | +0.38 | +3.1 |
| 51 | Louisiana | 12.72 | 13.12 | -0.40 | -3.0 |
| US average | 18.31 | 17.45 | +0.86 | +4.9 |
Source: EIA, Electric Power Monthly, Table 5.6.A, data for July 2026, preliminary. Missouri and New Mexico tie at 16.09 cents. The change columns are arithmetic on EIA’s figures.
Connecticut is the one large drop. Its regulator approved an interim decision to cut residential rates from May 1, 2026, including 4.3 cents per kWh for the average Eversource customer, by turning a public benefits charge into a credit that is scheduled to run through at least September.
Louisiana had the lowest price in July, but North Dakota had the lowest for January through July 2026, at 12.36 cents. The state at the bottom of the ranking depends on the period you pick.
The five most expensive states
Hawaii, California, Maine, Massachusetts and New York rank one through five in the July 2026 table.
1. Hawaii
Hawaii also tops the year-to-date ranking. Its customers averaged 46.28 cents per kWh from January through July 2026, against 41.08 cents a year earlier.
EIA says Hawaii’s prices are high mainly because most of its electricity is generated with petroleum fuels that have to be imported. Hawaiian Electric reports that 36.8% of the power it generated in 2025 came from renewables.
2. California
California’s year-to-date price was 33.25 cents per kWh for January through July 2026, second only to Hawaii. If you live there, your rate can include wildfire costs. Lawrence Berkeley National Laboratory found that the state’s three large investor-owned utilities were authorized to include $27 billion in wildfire-related costs in retail prices from 2019 to 2023.
3. Maine
Maine’s July price was nearly a sixth higher than a year earlier. Lawrence Berkeley National Laboratory’s review of 2025 price changes lists storm-cost recovery and regional transmission costs for Maine, where Central Maine Power’s storm surcharge rose to 2.5 cents per kWh in 2025 from 1.8 cents in 2024.
4. Massachusetts
Massachusetts households used 570 kWh a month in 2024, about two-thirds of the US average, and still ran up the fourth-highest bill at $167.20. EIA said in May 2025 that residential prices in New England, where they were already high, could increase more than the national average.
5. New York
New York’s July price was nearly a seventh higher than a year earlier. New Yorkers used 571 kWh a month in 2024, the fourth lowest of any state, and their average bill was $139.53.
The five cheapest states
Louisiana, Nevada, Utah, North Dakota and Tennessee sit at the bottom of the July 2026 table. A low price doesn’t guarantee a low bill. Louisiana’s customers use more than twice as much grid electricity as those in Hawaii or California, and EIA estimated their average bill at $142 a month in 2024, nearly equal to the national average.
Average monthly electric bill by state
The average US household paid $142.26 a month for electricity in 2024, and Hawaii’s customers paid the most at $212.12. The table shows the ten states at each end of the ranking.
| Rank | State | Average bill ($/month) | Use (kWh/month) | Price (cents/kWh) |
|---|---|---|---|---|
| 1 | Hawaii | 212.12 | 495 | 42.86 |
| 2 | Connecticut | 199.66 | 695 | 28.75 |
| 3 | Alabama | 173.50 | 1,143 | 15.18 |
| 4 | Massachusetts | 167.20 | 570 | 29.35 |
| 5 | Maryland | 165.87 | 929 | 17.86 |
| 6 | Texas | 163.72 | 1,096 | 14.94 |
| 7 | Rhode Island | 162.40 | 567 | 28.65 |
| 8 | California | 160.86 | 503 | 31.97 |
| 9 | Arizona | 160.24 | 1,075 | 14.91 |
| 10 | Florida | 156.09 | 1,104 | 14.14 |
| 42 | Wisconsin | 110.87 | 645 | 17.18 |
| 43 | Nebraska | 110.28 | 956 | 11.53 |
| 44 | Minnesota | 110.06 | 712 | 15.45 |
| 45 | Illinois | 109.99 | 693 | 15.87 |
| 46 | Idaho | 108.73 | 944 | 11.52 |
| 47 | Montana | 107.91 | 852 | 12.66 |
| 48 | Wyoming | 107.65 | 863 | 12.47 |
| 49 | Colorado | 100.57 | 674 | 14.92 |
| 50 | Utah | 94.57 | 774 | 12.22 |
| 51 | New Mexico | 92.88 | 654 | 14.20 |
Source: EIA, Electric Sales, Revenue, and Average Price, 2024 data, Table 5A. Ranks run from 1 (highest bill) to 51 (lowest) across 50 states and DC. Figures are for 2024, the latest full year in this EIA report.
Price and bill don’t rank the same. Alabama’s customers used 1,143 kWh a month in 2024, against 863 kWh nationally. Their average bill of $173.50 ranked third, even though their price of 15.18 cents per kWh was below the US average of 16.48 cents.
EIA says Southeastern customers use more electricity because of summer air conditioning. An earlier EIA estimate, built from preliminary monthly data, put the 2024 US average bill at $144 and found the six smallest bills all in the Rocky Mountain region, and the final data in the table are slightly lower.
How the US average price has changed since 2001
The US average residential price was 17.30 cents per kWh in 2025 and 8.24 cents in 2000, so it has more than doubled in nominal terms.
| Year | US average (cents/kWh) |
|---|---|
| 2001 | 8.58 |
| 2002 | 8.44 |
| 2003 | 8.72 |
| 2004 | 8.95 |
| 2005 | 9.45 |
| 2006 | 10.4 |
| 2007 | 10.65 |
| 2008 | 11.26 |
| 2009 | 11.51 |
| 2010 | 11.54 |
| 2011 | 11.72 |
| 2012 | 11.88 |
| 2013 | 12.13 |
| 2014 | 12.52 |
| 2015 | 12.65 |
| 2016 | 12.55 |
| 2017 | 12.89 |
| 2018 | 12.87 |
| 2019 | 13.01 |
| 2020 | 13.15 |
| 2021 | 13.66 |
| 2022 | 15.04 |
| 2023 | 16 |
| 2024 | 16.48 |
| 2025 | 17.3 |
Source: EIA, Monthly Energy Review, Table 9.8. Prices are in nominal dollars.
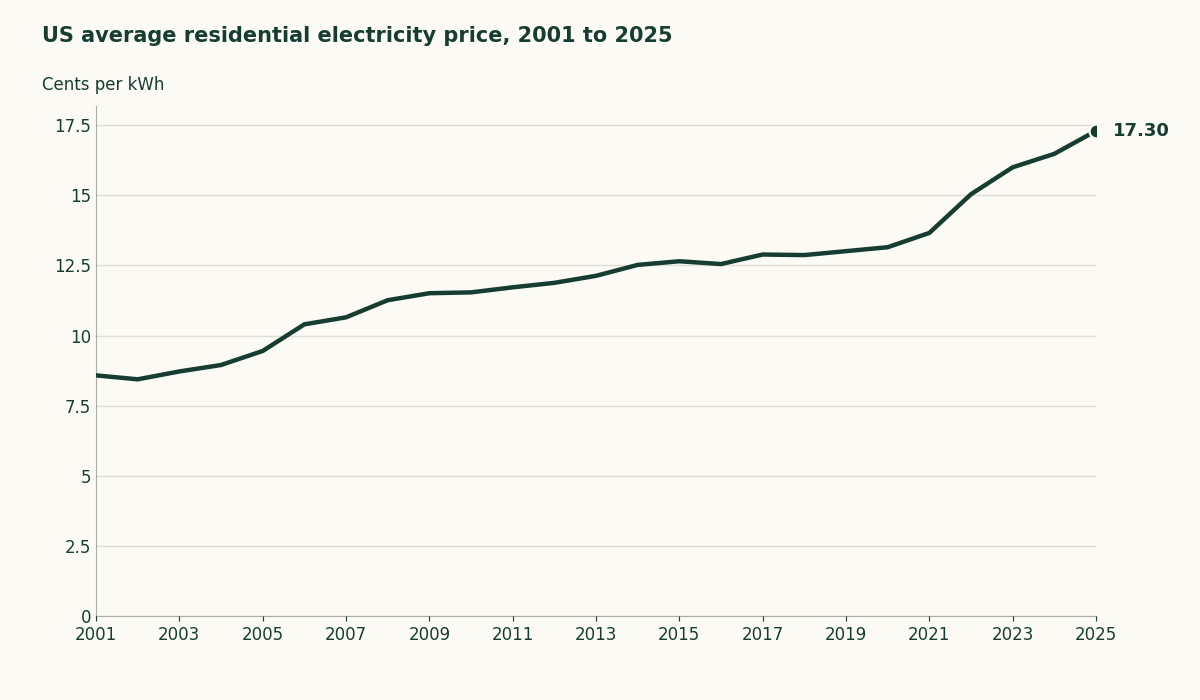
Adjusted for inflation, the picture is flatter. EIA found that the average residential price rose by less than 1% from 2013 to 2023 in inflation-adjusted terms.
EIA’s September 2026 Short-Term Energy Outlook forecasts 18.2 cents per kWh in 2026 and 18.6 cents in 2027. For prices abroad, see electricity prices in other countries.
What pushed prices up in 2025
Natural gas delivered to power plants rose 36% in 2025 from its record low in 2024, and Lawrence Berkeley National Laboratory counted gas as a driver of retail price changes in 21 states, with wholesale prices rising most in New England and New York.
In the PJM grid region, LBL found that retail prices rose 3.1 cents per kWh in DC and 2.0 cents in New Jersey between 2024 and 2025. LBL says that is in part due to higher PJM capacity auction prices.
PJM’s auction for the 2028/2029 delivery year cleared every zone at its $325 per MW-day cap. Utility Dive reported that the results reflected about 2 GW more forecast demand, largely from data centers, and that ratepayers should see little change in their electric bills when that delivery year starts on June 1, 2028.
Utilities requested or were granted $29 billion in rate increases in the first half of 2025, according to the advocacy group PowerLines.
Utilities are also spending more on the wires to your door. EIA’s analysis of utility filings found that distribution spending has passed spending on transmission and production.
The studies cited here cover 2025, so they don’t explain each state’s July 2026 change.
Rising demand and aging wires sit behind some of these increases, and our look at why the US power grid is under strain covers how AI demand and old equipment are straining it. If you want a plan for outages, the page on whole home battery backup systems covers what they cost.
How utilities and retail choice change what you pay
Your utility’s role depends on your state’s market. In regulated markets, utilities are typically vertically integrated monopolies that generate, transmit and distribute electricity for their customers. In restructured markets, utilities that serve retail customers are only responsible for delivering electricity and other companies generate it.
EIA describes the split this way. In some states commissions fully regulate prices, and in others generators’ prices are unregulated while transmission and distribution prices stay regulated.
Many states restructured from the 1990s onward to create competition and lower costs. Retail choice sits on top of that. It lets customers buy electricity from competitive retail suppliers, and EPA says it isn’t widely available in most parts of the country. In Texas, about 85% of electricity consumers can choose their retail provider, including those in Dallas and Houston.
Even where you can choose, distribution and transmission, which make up nearly 40% of the average electric bill, are still recovered through rate regulation.
How to find your own rate on your bill
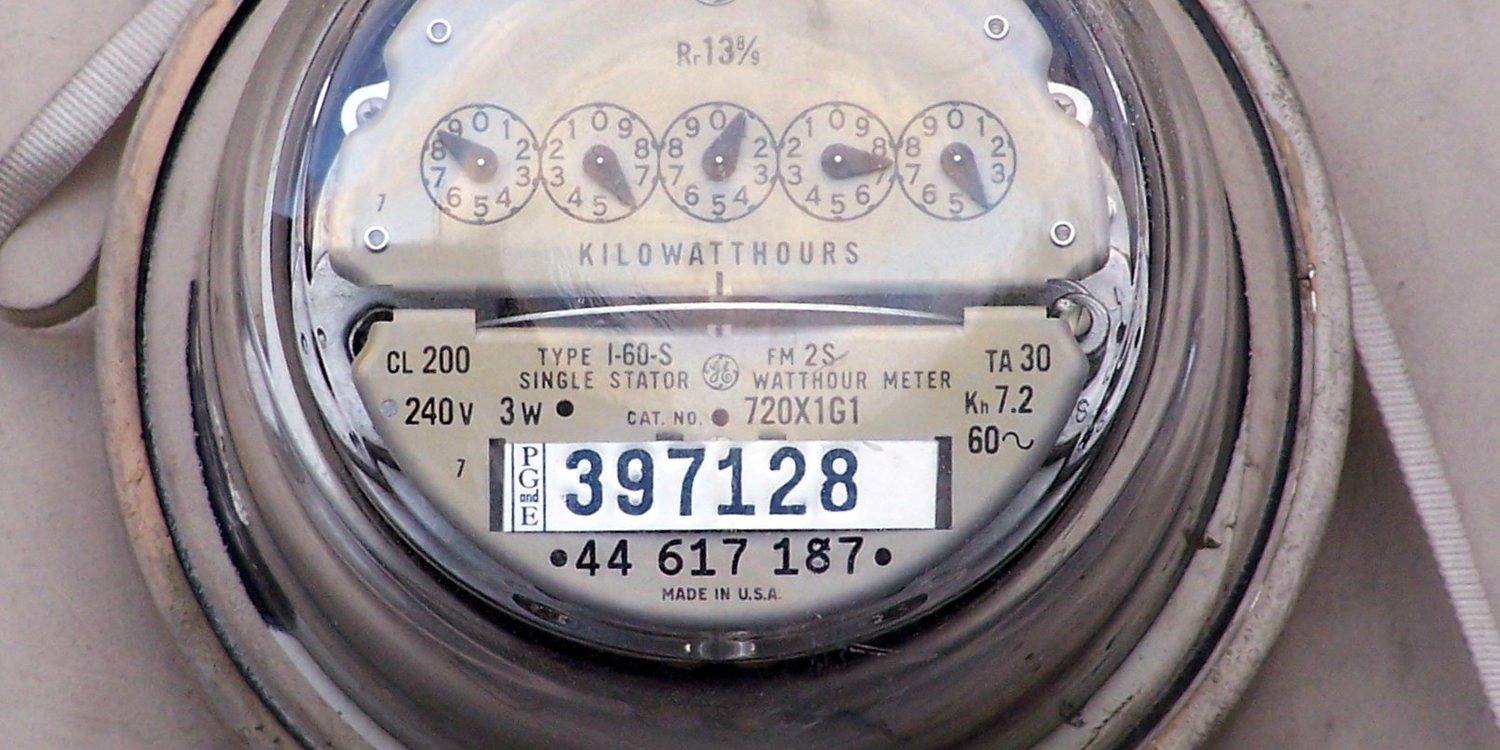
Your latest bill shows the total you owe and the kilowatt-hours you used. Divide the total by the kilowatt-hours and you have your all-in price per kWh, the same math EIA uses for the table. EIA’s 2024 US average works out the same way, $142.26 for 863 kWh, listed at 16.48 cents per kWh.
Compare your result with your state’s row in the table, and remember the table shows July, a summer month. If your price is close to your state’s but your bill is high, the difference is how much you use, and our look at how much energy the US wastes shows where it goes.