China emitted 12.3 billion tonnes of fossil carbon dioxide in 2024, out of a world total of 38.6 billion tonnes, according to the Global Carbon Budget. China’s share was 32%, with the US at 13%. The order shifts when you count per person or count what each country buys, and the datasets disagree on the world total.
Top carbon emissions statistics
- Researchers at the Global Carbon Project projected world fossil CO2 at 38.1 billion tonnes in 2025, up 1.1% and a record high.
- EDGAR, the European Commission’s emissions database, counted 54.1 billion tonnes of greenhouse gases in CO2-equivalent in 2025, up 0.7% on 2024.
- Some of the wealthiest countries emit 100 times more CO2 per person than the poorest, according to Our World in Data (OWID).
- US energy-related CO2 rose 2% in 2025, about 115 million tonnes, by EIA’s preliminary count.
- A CREA analysis published in Carbon Brief put China’s CO2 about 0.3% lower in 2025.
- Global power-sector emissions were almost flat in 2025, down 0.04%, Ember found.
- On a consumption basis, the UK emitted 487 million tonnes of CO2 in 2023, against 308 million made inside its borders.
- The EU’s net greenhouse gas emissions were an estimated 37% below 1990 in 2024, the European Environment Agency reports.
- NOAA measured carbon dioxide at Mauna Loa at 426.07 ppm in September 2026, up from 424.37 ppm a year earlier.
Which countries emit the most carbon dioxide?
The US ranked second in 2024 and India third, with 4.9 and 3.2 billion tonnes of fossil CO2. The table ranks countries by territorial fossil carbon dioxide, meaning the carbon dioxide released inside each country’s borders.
| Rank | Country | CO2 in 2024 (Mt) | CO2 per person in 2024 (t) | Share of world in 2024 (%) | Change since 2005 (%) | Change since 1990 (%) |
|---|---|---|---|---|---|---|
| 1 | China | 12,289.0 | 8.66 | 31.84 | 108.9 | 394.8 |
| 2 | United States | 4,904.1 | 14.2 | 12.71 | -20.0 | -4.4 |
| 3 | India | 3,193.5 | 2.2 | 8.27 | 167.1 | 452.5 |
| 4 | Russia | 1,780.5 | 12.29 | 4.61 | 13.8 | -29.8 |
| 5 | Japan | 961.9 | 7.77 | 2.49 | -25.2 | -16.7 |
| 6 | Indonesia | 812.2 | 2.87 | 2.1 | 133.8 | 424.0 |
| 7 | Iran | 792.6 | 8.66 | 2.05 | 69.8 | 275.5 |
| 8 | Saudi Arabia | 692.1 | 20.38 | 1.79 | 67.9 | 280.4 |
| 9 | South Korea | 583.7 | 11.29 | 1.51 | 17.0 | 133.0 |
| 10 | Germany | 572.3 | 6.77 | 1.48 | -34.1 | -45.7 |
| 11 | Canada | 533.3 | 13.42 | 1.38 | -6.5 | 16.4 |
| 12 | Turkey | 513.0 | 5.87 | 1.33 | 91.6 | 231.9 |
| 13 | Brazil | 483.0 | 2.28 | 1.25 | 32.6 | 120.9 |
| 14 | Mexico | 461.0 | 3.52 | 1.19 | -0.5 | 45.5 |
| 15 | South Africa | 439.8 | 6.87 | 1.14 | 5.7 | 40.6 |
| 16 | Australia | 386.7 | 14.48 | 1.0 | 0.4 | 39.1 |
| 17 | Vietnam | 370.9 | 3.67 | 0.96 | 287.0 | 1641.5 |
| 18 | United Kingdom | 312.9 | 4.53 | 0.81 | -45.1 | -48.0 |
| 19 | Italy | 301.9 | 5.09 | 0.78 | -39.8 | -31.1 |
| 20 | Malaysia | 290.2 | 8.16 | 0.75 | 70.7 | 434.8 |
| 21 | Kazakhstan | 287.0 | 13.94 | 0.74 | 44.6 | 7.3 |
| 22 | Poland | 272.9 | 7.08 | 0.71 | -15.4 | -27.5 |
| 23 | Thailand | 267.8 | 3.74 | 0.69 | 24.9 | 209.3 |
| 24 | France | 264.2 | 3.97 | 0.68 | -36.6 | -33.1 |
| 25 | Taiwan | 262.3 | 11.3 | 0.68 | -1.7 | 111.1 |
Source: Global Carbon Project, Global Carbon Budget 2025 national fossil CO2 data for 2024 (CC BY 4.0), processed by OWID, which also calculates the per person, share and percentage columns. Mt is million tonnes. Totals cover fossil fuels and cement and leave out land use and international aviation and shipping.
These totals count carbon dioxide from the burning of fossil fuels and from industrial processes. International aviation and shipping appear in the world total but in no country’s row.
The two change columns split the list. India’s emissions are more than double their 2005 level, while the UK’s are down by almost half.
How much carbon dioxide does the world emit?
Global Carbon Budget researchers put world fossil CO2 at 37.8 billion tonnes in 2024, up 1.1% on 2023. The paper subtracts the carbon dioxide that cement reabsorbs through carbonation. The history table below comes from the same data without that subtraction, so its figures run a little higher.
| Year | World fossil CO2 (billion tonnes) |
|---|---|
| 2000 | 25.51 |
| 2001 | 25.69 |
| 2002 | 26.27 |
| 2003 | 27.65 |
| 2004 | 28.61 |
| 2005 | 29.6 |
| 2006 | 30.59 |
| 2007 | 31.5 |
| 2008 | 32.05 |
| 2009 | 31.51 |
| 2010 | 33.32 |
| 2011 | 34.48 |
| 2012 | 34.95 |
| 2013 | 35.28 |
| 2014 | 35.47 |
| 2015 | 35.4 |
| 2016 | 35.39 |
| 2017 | 35.97 |
| 2018 | 36.73 |
| 2019 | 37.09 |
| 2020 | 35.16 |
| 2021 | 36.87 |
| 2022 | 37.53 |
| 2023 | 38.09 |
| 2024 | 38.6 |
Source: Global Carbon Project, Global Carbon Budget 2025, processed by OWID. The series includes international aviation and shipping and leaves out land use.
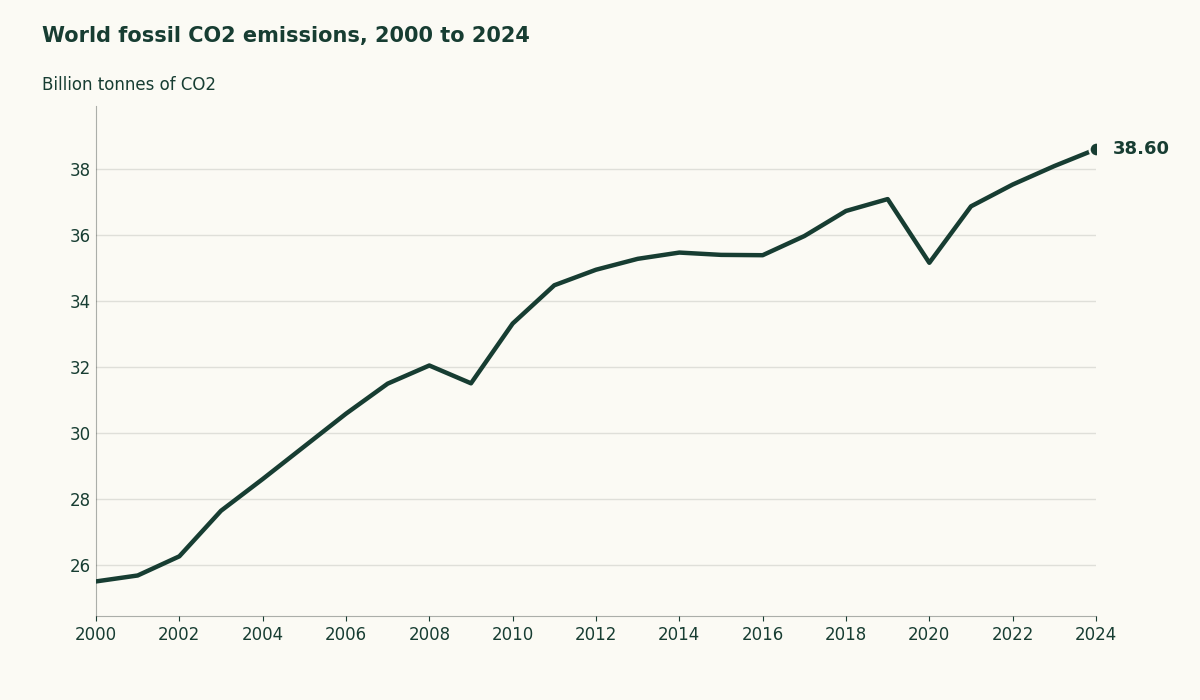
The world total fell in four of the 24 years since 2000 and rose in the other 20.
Who has emitted the most since 1750?
The US has emitted 434.9 billion tonnes of CO2 since 1750, or 23.5% of the world’s cumulative total, more than any other country, with China second.
| Rank | Country | Cumulative CO2 1750 to 2024 (Gt) | Share of world cumulative (%) |
|---|---|---|---|
| 1 | United States | 434.9 | 23.5 |
| 2 | China | 285.1 | 15.4 |
| 3 | Russia | 122.8 | 6.6 |
| 4 | Germany | 95.1 | 5.1 |
| 5 | United Kingdom | 80.1 | 4.3 |
| 6 | Japan | 69.6 | 3.8 |
| 7 | India | 66.1 | 3.6 |
| 8 | France | 40.0 | 2.2 |
Source: OWID, cumulative CO2 emissions, built on the same national data. Fossil fuels and cement only, with land use left out.
For how those accumulated tonnes connect to warming, see the evidence that the climate is changing.
Why do the world totals differ?
For 2025 the Global Carbon Project’s projection is 38.1 billion tonnes of CO2 from fossil fuels and cement, while EDGAR counts 39.96 billion. The IEA lands in between and the Energy Institute below, and the gap comes from what each one counts.
| Dataset | World CO2 in 2025 (billion tonnes) | Change on 2024 (%) | What it counts |
|---|---|---|---|
| EDGAR 2026 report | 39.96 | 0.5 | Fossil CO2, industrial processes, international aviation and shipping |
| IEA | nearly 38.4 | about 0.4 | Energy-related CO2 |
| Global Carbon Project | 38.1 | 1.1 | Fossil CO2 and cement, less cement carbonation (projection) |
| Energy Institute | 35.8 | 1.1 | CO2 from the energy sector only |
Source: EDGAR 2026 report data, IEA Global Energy Review 2026, the Global Carbon Project’s November 2025 release and the Energy Institute Statistical Review 2026. EDGAR’s change is calculated from its 2024 and 2025 totals.
Each figure measures a different slice of emissions, so the four totals can’t be compared line for line.
Country totals differ too. EDGAR counts 13,125.1 million tonnes for China in 2024, more than the figure in the ranked table.
The main country tables use the Global Carbon Budget 2025 national data for 2024, as processed by OWID. Consumption-based figures run one year behind the territorial series. The 2025 figures in this section are early estimates and projections, since country-level data for 2025 isn’t out yet.
How did China, the US, India, the EU and Russia change?
Between 2005 and 2024 emissions more than doubled in China and India and edged up in Russia, while the US and the EU cut theirs. The table gives each year in billion tonnes.
| Year | China (Gt) | United States (Gt) | India (Gt) | EU27 (Gt) | Russia (Gt) |
|---|---|---|---|---|---|
| 2005 | 5.88 | 6.13 | 1.2 | 3.73 | 1.56 |
| 2006 | 6.49 | 6.05 | 1.29 | 3.75 | 1.62 |
| 2007 | 6.97 | 6.12 | 1.39 | 3.7 | 1.62 |
| 2008 | 7.49 | 5.92 | 1.49 | 3.63 | 1.65 |
| 2009 | 7.88 | 5.49 | 1.61 | 3.33 | 1.55 |
| 2010 | 8.61 | 5.67 | 1.68 | 3.42 | 1.63 |
| 2011 | 9.52 | 5.54 | 1.77 | 3.33 | 1.68 |
| 2012 | 9.77 | 5.33 | 1.93 | 3.26 | 1.7 |
| 2013 | 9.94 | 5.47 | 2.0 | 3.18 | 1.64 |
| 2014 | 9.98 | 5.53 | 2.15 | 3.04 | 1.64 |
| 2015 | 9.86 | 5.37 | 2.23 | 3.09 | 1.64 |
| 2016 | 9.75 | 5.25 | 2.35 | 3.09 | 1.63 |
| 2017 | 10.0 | 5.2 | 2.43 | 3.12 | 1.66 |
| 2018 | 10.35 | 5.36 | 2.6 | 3.05 | 1.71 |
| 2019 | 10.71 | 5.24 | 2.61 | 2.9 | 1.7 |
| 2020 | 10.9 | 4.69 | 2.42 | 2.63 | 1.63 |
| 2021 | 11.28 | 5.02 | 2.68 | 2.8 | 1.67 |
| 2022 | 11.71 | 5.06 | 2.83 | 2.74 | 1.68 |
| 2023 | 12.17 | 4.92 | 3.06 | 2.48 | 1.73 |
| 2024 | 12.29 | 4.9 | 3.19 | 2.43 | 1.78 |
Source: Global Carbon Budget 2025 data supplement, processed by OWID. EU27 counts the 27 member states together.
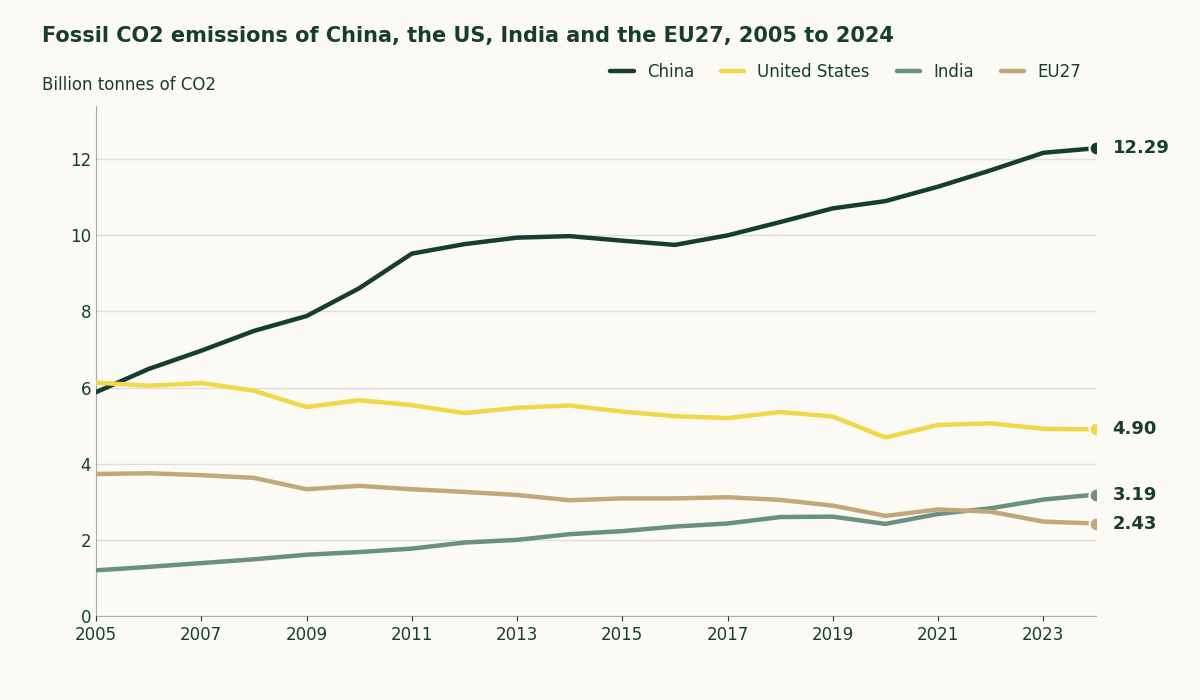
The 2025 readings disagree about China. The paper’s 2025 projection had China’s fossil CO2 rising 0.4%. The IEA reports that China’s energy CO2 declined by around 0.5%, and the CREA analysis behind the Carbon Brief estimate puts the fall near 0.3%.
AFP reported that the drop is so small that it is not yet clear emissions have peaked. China’s power-sector emissions fell 0.7% in 2025, and India’s fell 2.9%, according to Ember. The power side is covered in how China makes its electricity.
The US moved the other way. If you’re on the US grid, the electricity behind your outlets comes from the sector where EIA found CO2 up 4%, or 58 million tonnes, in 2025. The Energy Institute says more than a third of the 2025 rise in world energy CO2 came from the US.
Which countries emit the most carbon dioxide per person?
Qatar emitted 41.3 tonnes of CO2 per person in 2024, the most of any country with a million or more people, and Gulf states hold six of the seven places at the head of the table.
| Rank | Country | CO2 per person in 2024 (t) | CO2 in 2024 (Mt) | Population in 2024 (millions) |
|---|---|---|---|---|
| 1 | Qatar | 41.27 | 125.8 | 3.0 |
| 2 | Kuwait | 26.25 | 129.5 | 4.9 |
| 3 | Bahrain | 24.27 | 39.0 | 1.6 |
| 4 | Trinidad and Tobago | 22.93 | 34.6 | 1.5 |
| 5 | Saudi Arabia | 20.38 | 692.1 | 34.0 |
| 6 | United Arab Emirates | 20.13 | 222.0 | 11.0 |
| 7 | Oman | 15.65 | 82.7 | 5.3 |
| 8 | Australia | 14.48 | 386.7 | 26.7 |
| 9 | United States | 14.2 | 4,904.1 | 345.4 |
| 10 | Kazakhstan | 13.94 | 287.0 | 20.6 |
| 11 | Canada | 13.42 | 533.3 | 39.7 |
| 12 | Mongolia | 12.86 | 44.7 | 3.5 |
| 13 | Russia | 12.29 | 1,780.5 | 144.8 |
| 14 | Taiwan | 11.3 | 262.3 | 23.2 |
| 15 | South Korea | 11.29 | 583.7 | 51.7 |
| European Union (27) | 5.39 | 2,426.2 | 450.3 | |
| World | 4.73 | 38,598.6 | 8162.0 |
Source: OWID, CO2 emissions per capita, built on the same national data and OWID’s population estimates. Countries with a million or more people, plus the EU27 and the world for comparison.
If you live in the US, your country’s average is 14.2 tonnes of CO2 a year per person, against 5.39 in the EU. The per person column in the ranked table shows how far China sits below the US and how much further India sits below China.
What is a country’s carbon footprint?
By consumption, the US emitted 5,431.7 million tonnes of CO2 in 2023, which is 513.3 million more than it produced inside its borders. OWID defines consumption-based emissions as production-based emissions, minus emissions embedded in exports, plus emissions embedded in imports.
| Rank | Country | Territorial CO2 in 2023 (Mt) | Consumption-based CO2 in 2023 (Mt) | Difference (Mt) | Difference (%) |
|---|---|---|---|---|---|
| 1 | China | 12,172.0 | 10,857.0 | -1,315.0 | -10.8 |
| 2 | United States | 4,918.4 | 5,431.7 | 513.3 | 10.4 |
| 3 | India | 3,062.8 | 2,543.2 | -519.5 | -17.0 |
| 4 | Russia | 1,733.1 | 1,406.0 | -327.2 | -18.9 |
| 5 | Japan | 986.9 | 1,142.3 | 155.4 | 15.7 |
| 6 | Germany | 593.8 | 768.5 | 174.7 | 29.4 |
| 7 | Indonesia | 762.4 | 728.2 | -34.2 | -4.5 |
| 8 | South Korea | 589.2 | 708.9 | 119.7 | 20.3 |
| 9 | Iran | 789.7 | 668.6 | -121.1 | -15.3 |
| 10 | Saudi Arabia | 677.4 | 654.1 | -23.3 | -3.4 |
| 11 | Mexico | 458.3 | 565.0 | 106.7 | 23.3 |
| 12 | Canada | 545.5 | 519.9 | -25.5 | -4.7 |
| 13 | United Kingdom | 307.8 | 487.1 | 179.3 | 58.2 |
| 14 | Turkey | 486.9 | 483.0 | -3.9 | -0.8 |
| 15 | Brazil | 484.0 | 470.0 | -14.0 | -2.9 |
Source: OWID, consumption-based CO2 emissions, built on the same national data. The consumption series ends in 2023, so these figures are a year older than the first table.
China and India are net exporters of emissions on this measure, as is Russia. The US, Japan, Germany and the UK are net importers.
If you live in the UK, the goods you buy count in the government’s own consumption-based statistics, which follow the spending of UK residents wherever in the world the emissions arise. The territorial side of Germany’s gap is covered in Germany’s coal and nuclear choices.
What changes when every greenhouse gas is counted?
Fossil CO2 was 73.8% of the world’s greenhouse gas emissions in 2025 and methane 17.6%, by EDGAR’s count. EDGAR converts the other gases to CO2-equivalent with IPCC AR5 100-year warming potentials.
Adding the other gases and land use reshuffles the list. Brazil is fourth on all greenhouse gases in 2024 and thirteenth on fossil CO2.
| Rank | Country | All greenhouse gases in 2024 (Mt CO2eq) | Fossil CO2 in 2024 (Mt) | Fossil CO2 rank |
|---|---|---|---|---|
| 1 | China | 14,107.0 | 12,289.0 | 1 |
| 2 | United States | 6,054.3 | 4,904.1 | 2 |
| 3 | India | 4,262.4 | 3,193.5 | 3 |
| 4 | Brazil | 2,804.4 | 483.0 | 13 |
| 5 | Russia | 2,729.2 | 1,780.5 | 4 |
| 6 | Indonesia | 1,902.5 | 812.2 | 6 |
| 7 | Iran | 1,012.2 | 792.6 | 7 |
| 8 | Japan | 1,007.2 | 961.9 | 5 |
| 9 | Saudi Arabia | 821.8 | 692.1 | 8 |
| 10 | Canada | 802.7 | 533.3 | 11 |
Source: OWID, greenhouse gas emissions including land use, which uses Jones et al. (2025) for the gases, and the Global Carbon Budget 2025 for fossil CO2.
EDGAR leaves land use out and ranks Brazil sixth in 2025. The six largest emitters in EDGAR’s count produced 62% of the world’s greenhouse gas emissions in 2025. National inventories run further behind, and the latest finished US report on EPA’s inventory page counts 6,343 million tonnes of CO2-equivalent in 2022.
The November 2026 update and the 2035 targets
OWID expects its next update of this data on 13 November 2026. China’s 2035 target is a cut in net greenhouse gases of 7 to 10% from peak levels, which Climate Action Tracker says is likely to deliver only limited additional reductions.
The EU’s member states project a 47% net cut from 1990 by 2030 on current policies. Targets like these are what the UN climate talks argue over, and how carbon pricing works covers one tool governments use to put a price on emissions like these.
To check a country that isn’t in the tables, OWID’s CO2 pages let you chart any country’s annual and cumulative emissions.
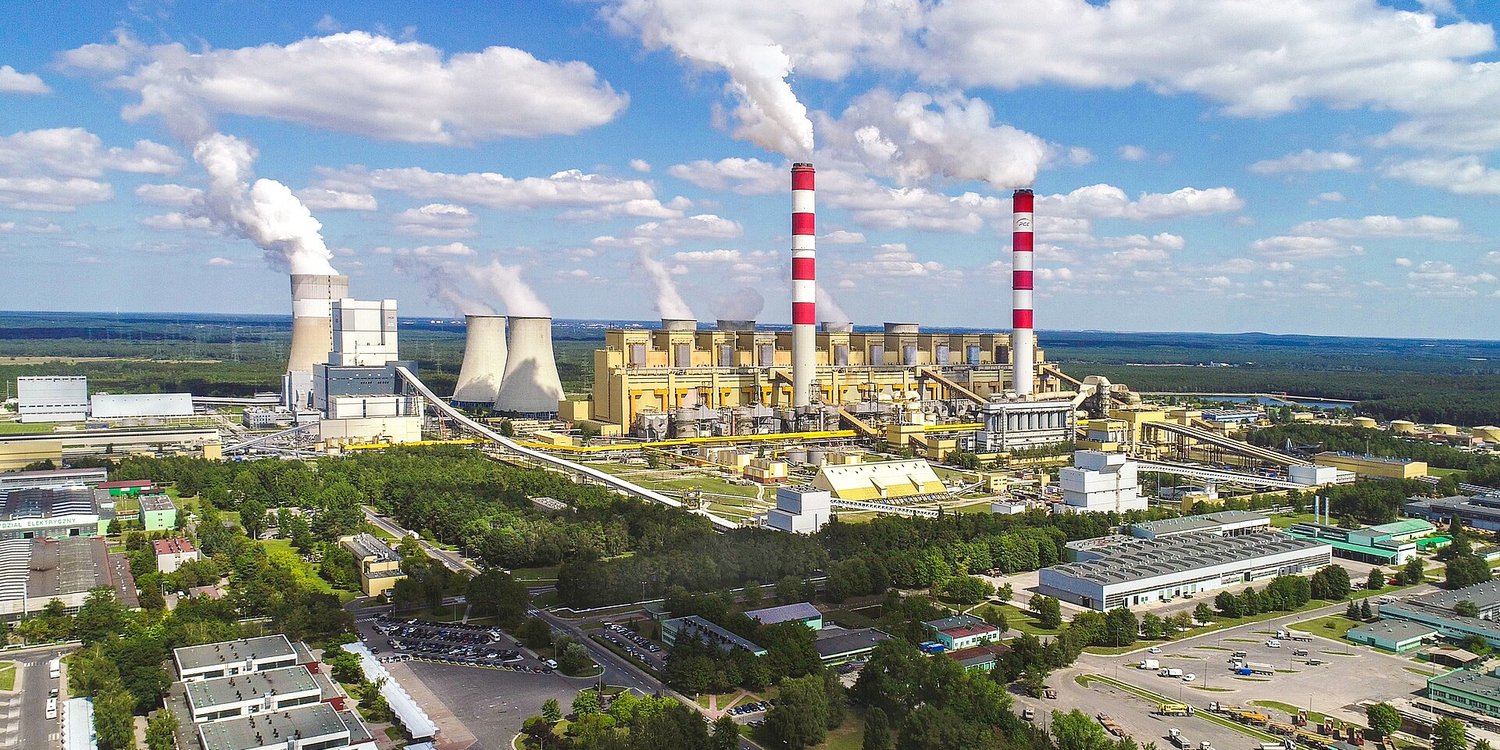
Top photo: PGEGiEK, CC BY-SA 4.0, via Wikimedia Commons, cropped.