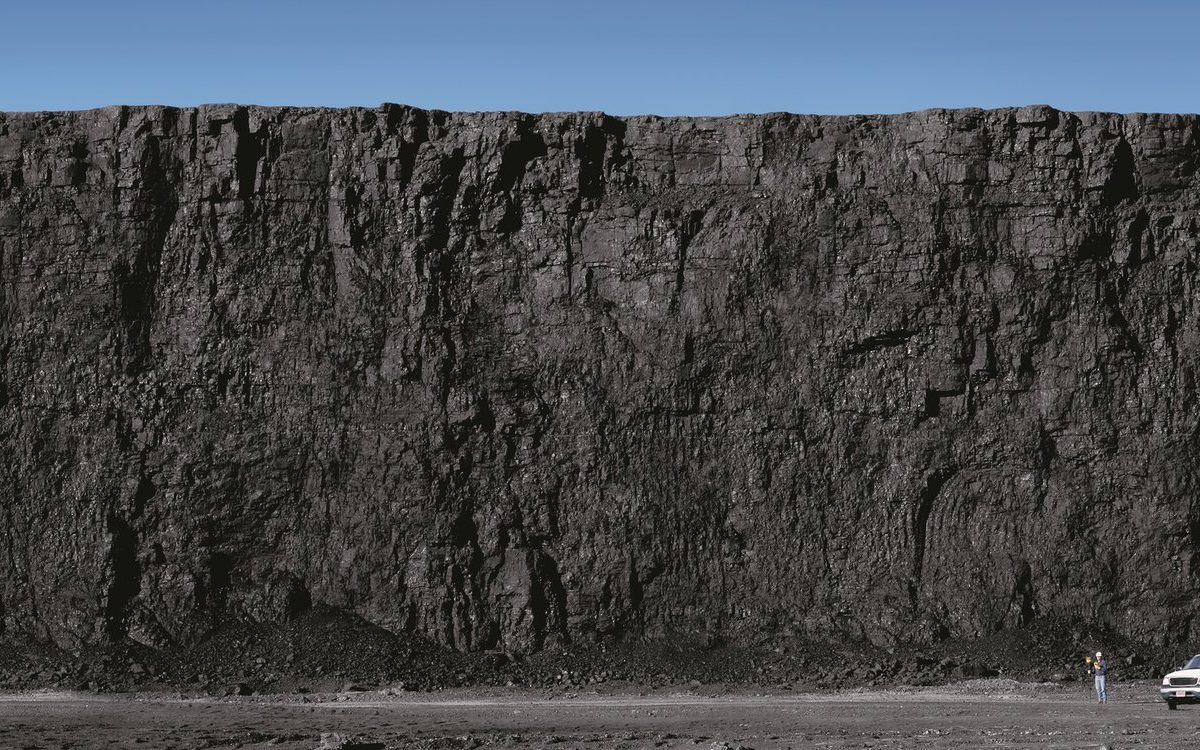
Fossil fuels supplied 86% of the world’s energy in 2025, according to the Energy Institute’s Statistical Review. The US got 82% of its energy from them in 2025, by EIA’s count. The figures below come mostly from the Energy Institute and EIA, and each one says the year it covers.
Top fossil fuel statistics
- World energy supply passed 600 exajoules in 2025, up 1.7% on 2024, according to the Energy Institute.
- The world used 103 million barrels of oil a day in 2025, 1.3% more than in 2024.
- Coal fell from 37% of US energy use in 1950 to 9% in 2025.
- Researchers at the Global Carbon Project projected fossil CO2 emissions of 38.1 billion tonnes in 2025, a record high.
- Carbon dioxide in the air at Mauna Loa averaged 427.55 ppm in August 2026, up from 425.48 ppm a year earlier.
- Global fossil power generation fell 38 TWh in 2025, the first year without a rise since 2020.
- The IMF counted $725 billion in explicit fossil fuel subsidies in 2024.
- Brent crude went above $100 a barrel in March 2026 after Iran effectively closed the Strait of Hormuz.
What are fossil fuels?
Fossil fuels come in three types, and all three began as the remains of plants and animals. Over time, pressure and heat changed some of that buried material into coal and some into oil and gas.
Coal holds the energy of plants that lived hundreds of millions of years ago in swampy forests. Crude oil formed from animals and plants, called diatoms, that lived millions of years ago in a marine environment.
The table sets the three fuels side by side.
| Fuel | World use in 2025 (EJ) | Share of world energy in 2025 (%) | CO2 from burning it in 2024 (Gt) | CO2 per million Btu (kg) | Share of US energy in 2025 (%) |
|---|---|---|---|---|---|
| Oil | 201.0 | 33.5 | 12.47 | 70.66 (motor gasoline) / 74.14 (diesel) | 38 |
| Coal | 166.0 | 27.7 | 15.81 | 95.99 | 9 |
| Natural gas | 150.7 | 25.1 | 8.01 | 52.91 | 36 |
| All fossil fuels | 517.7 | 86.2 | 36.29 | n/a | 82 |
Source: Our World in Data (OWID) on energy use and OWID on CO2 by fuel, which build on the Energy Institute Statistical Review 2026 and the Global Carbon Budget 2025. Emission coefficients come from EIA and US shares from EIA. The exajoule and share columns are arithmetic on the Energy Institute series. EIA rounds each US share, so the three fuels add to 83 while EIA’s fossil total is 82.
Oil is the biggest of the three by energy at 201.0 exajoules in 2025. Coal is the biggest by CO2, at 15.81 billion tonnes in 2024.
How much of the world’s energy comes from fossil fuels?
Fossil fuels supplied 86.2% of world primary energy in 2025, down from 95.7% in 1975.
The table gives world use of coal, oil and natural gas in exajoules, a unit of energy.
| Year | Coal (EJ) | Oil (EJ) | Natural gas (EJ) |
|---|---|---|---|
| 2001 | 100.4 | 156.2 | 87.5 |
| 2002 | 104.3 | 157.4 | 90.2 |
| 2003 | 113.3 | 160.8 | 92.6 |
| 2004 | 121.0 | 167.1 | 96.4 |
| 2005 | 130.4 | 168.8 | 98.8 |
| 2006 | 137.4 | 170.9 | 101.4 |
| 2007 | 145.1 | 172.8 | 105.6 |
| 2008 | 146.9 | 171.4 | 108.2 |
| 2009 | 144.5 | 167.6 | 105.9 |
| 2010 | 151.1 | 173.5 | 113.7 |
| 2011 | 158.1 | 175.0 | 116.5 |
| 2012 | 158.8 | 177.6 | 119.6 |
| 2013 | 161.1 | 179.5 | 121.3 |
| 2014 | 161.5 | 181.0 | 122.0 |
| 2015 | 157.3 | 184.6 | 124.9 |
| 2016 | 153.8 | 188.1 | 128.0 |
| 2017 | 155.3 | 191.3 | 131.6 |
| 2018 | 158.0 | 193.4 | 137.8 |
| 2019 | 156.3 | 193.6 | 140.5 |
| 2020 | 150.7 | 175.9 | 139.3 |
| 2021 | 159.2 | 185.9 | 144.8 |
| 2022 | 161.1 | 192.3 | 144.1 |
| 2023 | 163.8 | 196.8 | 144.5 |
| 2024 | 165.4 | 199.0 | 148.7 |
| 2025 | 166.0 | 201.0 | 150.7 |
Source: OWID on global primary energy use, built on the Energy Institute Statistical Review 2026 and converted from terawatt-hours to exajoules.
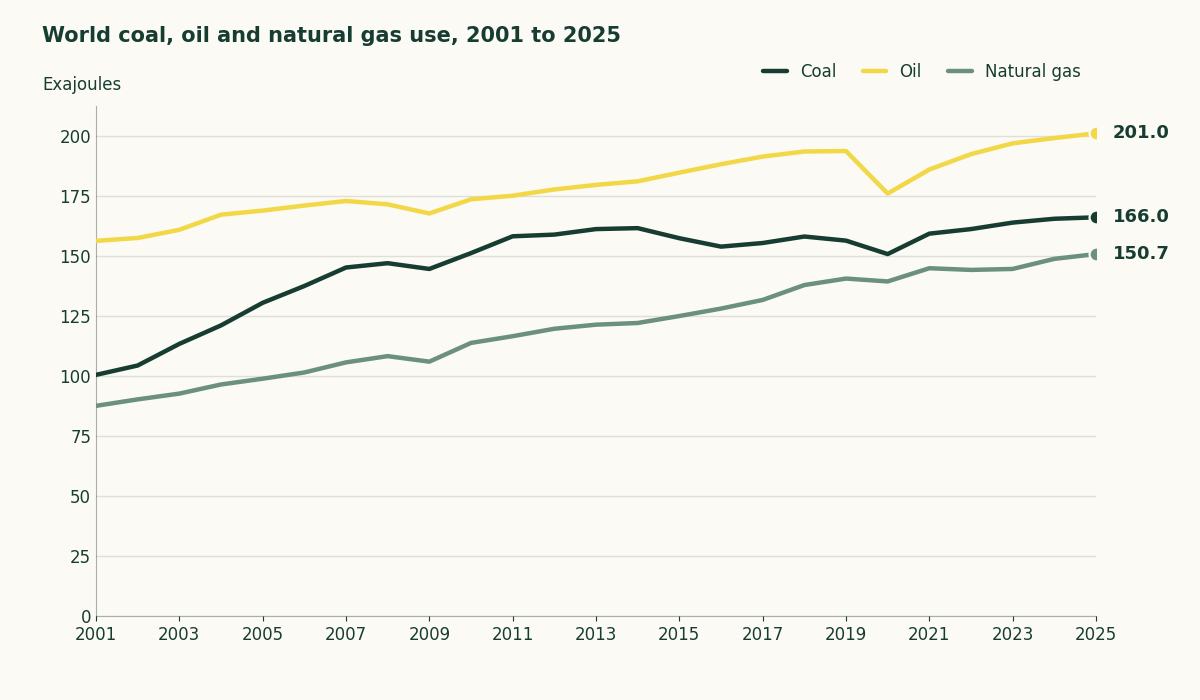
Natural gas use grew fastest of the three, from 87.5 exajoules in 2001 to 150.7 in 2025.
The Energy Institute counts world coal use up 0.7% and the IEA counts it up about 0.4%. For total energy, the IEA counts 1.3% growth against 1.7% in the Energy Institute’s review.
Which countries depend on fossil fuels the most?
Saudi Arabia got 99.4% of its primary energy from fossil fuels in 2025, the highest share in the table, and Norway got 46.9%.
| Country or region | Fossil share in 2015 (%) | Fossil share in 2025 (%) |
|---|---|---|
| Saudi Arabia | 100.0 | 99.4 |
| India | 95.4 | 93.0 |
| Russia | 90.1 | 89.8 |
| China | 93.9 | 87.5 |
| World | 89.1 | 86.2 |
| Japan | 95.2 | 85.7 |
| United States | 85.2 | 83.2 |
| European Union (27) | 76.9 | 73.2 |
| Brazil | 72.3 | 62.3 |
| Norway | 54.0 | 46.9 |
Source: OWID on fossil fuel share of energy, built on the Energy Institute Statistical Review 2026.
The table’s US figure comes from the Energy Institute’s data, while EIA’s own count for 2025 is 82%.
What are fossil fuels used for?
Transportation takes the largest share of US petroleum, 66.6% in 2022, according to EIA. The American Petroleum Institute, an oil and gas trade group, puts transportation fuels at 68% of US petroleum product demand in 2024.
EPA says over 94% of the fuel used for transportation is petroleum based.
Electricity is another use. About 60% of US electricity came from fossil fuels in 2023, so if you live in the US, most of the electricity behind your bill that year came from a fossil-fueled plant.
Worldwide, coal alone made 33.0% of electricity in 2025, behind renewable energy sources at 33.8%, Ember found. Solar power rose 636 TWh to 2,778 TWh in 2025, a 30% increase.
What happens when fossil fuels are burned?
Burning fossil fuels releases CO2, and a short ton of coal gives off 1,735.85 kilograms of it.
For the same amount of heat, coal releases 95.99 kilograms of CO2 per million Btu and natural gas 52.91, which puts coal at about 1.8 times gas.
Three groups gave three totals for 2025. The Global Carbon Budget paper projects 38.1 billion tonnes of fossil CO2, including cement carbonation. The Energy Institute counts 35,806.2 million tonnes from the energy sector, and the IEA counts nearly 38.4 billion tonnes of energy-related CO2. The three totals cover different sets of sources.
Natural gas caused 85 million of the 185 million tonnes by which the IEA says combustion emissions rose in 2025.
The same research puts what’s left of the 1.5°C carbon budget at 170 billion tonnes of CO2, about four years at 2025 emissions. The IPCC found that existing fossil fuel infrastructure would emit more CO2 over its lifetime than 1.5°C pathways allow.
How much fossil fuel is left?
US operators reported about 46 billion barrels of proved crude oil and lease condensate reserves at year-end 2024, 1% less than a year earlier. Proved natural gas reserves fell 3% to 584 trillion cubic feet.
Proved reserves are operators’ estimates of what can be recovered under existing economic and operating conditions, so they’re not a count of everything in the ground. For how shale changed US supply, see shale gas in the US.
OWID’s series from EIA lists 1,165.9 billion tonnes of proved coal reserves worldwide for 2023, the same figure it shows for 2022.
How much do fossil fuels cost?
Brent crude averaged $69.14 a barrel in 2025, and the table shows what oil and gas cost each year since 2014 in nominal dollars.
| Year | Brent crude ($ per barrel) | WTI crude ($ per barrel) | Henry Hub gas ($ per million Btu) |
|---|---|---|---|
| 2014 | 98.97 | 93.17 | 4.37 |
| 2015 | 52.32 | 48.66 | 2.62 |
| 2016 | 43.64 | 43.29 | 2.52 |
| 2017 | 54.13 | 50.80 | 2.99 |
| 2018 | 71.34 | 65.23 | 3.15 |
| 2019 | 64.30 | 56.99 | 2.56 |
| 2020 | 41.96 | 39.16 | 2.03 |
| 2021 | 70.86 | 68.13 | 3.89 |
| 2022 | 100.93 | 94.90 | 6.45 |
| 2023 | 82.49 | 77.58 | 2.53 |
| 2024 | 80.52 | 76.63 | 2.19 |
| 2025 | 69.14 | 65.39 | 3.52 |
Source: EIA, Europe Brent Spot Price FOB, EIA, Cushing WTI Spot Price, EIA, Henry Hub Natural Gas Spot Price. EIA’s annual gas table has no 2013 value, so this table starts in 2014.
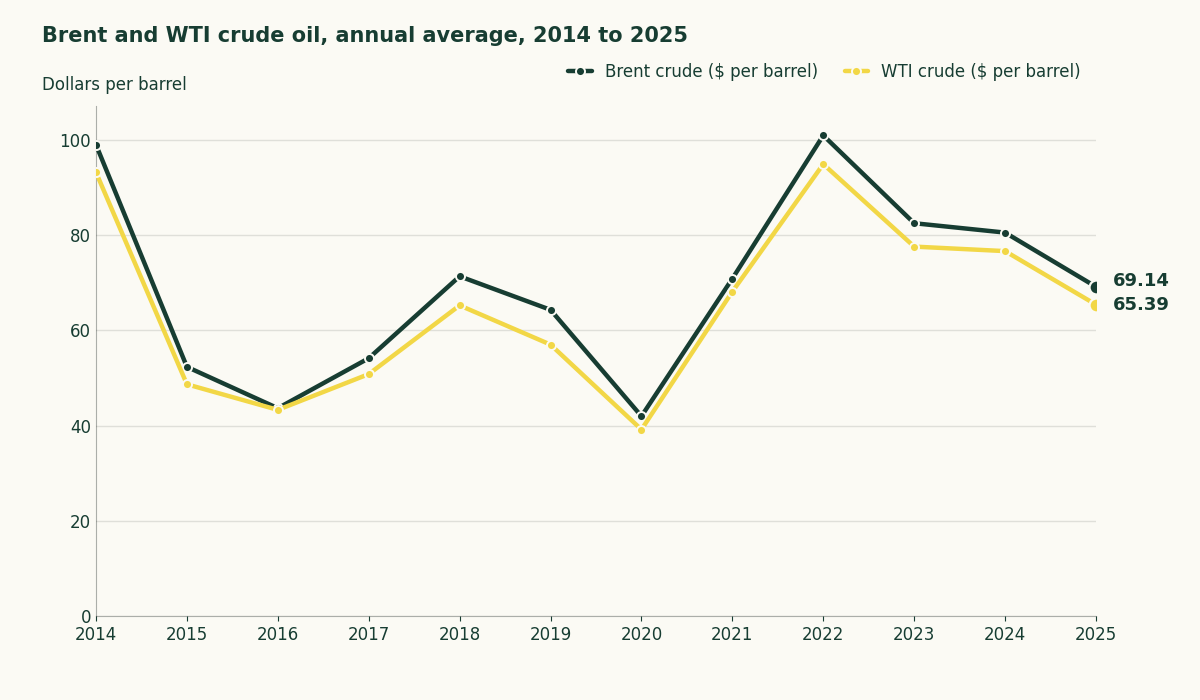
Prices jumped in 2026 when Iran effectively closed the Strait of Hormuz, pushing oil above $100 a barrel in March, the highest since 2022. The strait normally carries about one-fifth of global oil supplies.
The IEA agreed to release 400 million barrels from emergency stocks, the largest coordinated drawdown in its history. EIA estimates Brent averaged $102.93 in the second quarter of 2026.
EIA’s September outlook forecasts Brent averaging $91 a barrel in 2026 and $74 in 2027. If you drive, EIA forecasts regular gasoline at $3.84 a gallon in 2026 against $3.10 in 2025, a difference of 74 cents on every gallon you buy.
Henry Hub gas averaged $6.45 per million Btu in 2022 and $3.52 in 2025. For what moves oil prices, see oil prices and OPEC.
What are the pros and cons of fossil fuels?
The main advantage is a lot of energy in a small tank. A gallon of diesel holds 128,488 Btu, and a gallon of gasoline with ethanol blended in holds 112,114 to 116,090.
Another is jobs. The American Petroleum Institute says the US oil and gas industry supported 10.6 million jobs and contributed $2.1 trillion to the US economy in 2023.
Cost is a mixed argument. Lazard’s 2026 analysis puts new combined-cycle gas at $51 to $129 per megawatt-hour, unsubsidized. It puts new utility-scale solar at $40 to $98. Those are unsubsidized costs of building and running new plants, a different measure from the price on your bill.
Then there’s health. A 2023 BMJ study estimated 5.13 million excess deaths a year from air pollution caused by fossil fuels, using 2019 data. A Harvard-led study of 2018 put the figure at more than 8 million. The two studies cover different years and use different models.
Subsidies are the last piece. The IMF counted $725 billion in explicit subsidies in 2024 and $6.7 trillion in implicit ones, which are mostly environmental costs that prices leave out. The page on fossil fuel subsidies goes through them.
How we worked out these numbers
We took each fuel’s use from Our World in Data’s copy of the Energy Institute’s 2026 Statistical Review and converted terawatt-hours to exajoules at 277.78 per exajoule, since one terawatt-hour is 3.6 petajoules. Each fuel’s share is its use divided by the world total of 600.3 exajoules, which we summed from the same series.
The emissions totals for 2025 are projections or estimates, and EIA’s prices for 2026 are forecasts. We couldn’t verify a current world total for oil and gas reserves from a source that opens freely, so the reserves section gives US figures for those two fuels.
Two outlooks for coal, oil and gas to 2050
The IEA’s Current Policies Scenario in its 2025 outlook has oil and gas demand growing to mid-century, with coal declining before 2030. Its Stated Policies Scenario has oil demand flattening by the end of the decade and gas growing into the 2030s.
ExxonMobil’s outlook has oil and natural gas making up more than half of world energy supply in 2050, and expects the world to use 30% less coal in 2050 than in 2025. Both are scenarios.
To see how coal’s share of US energy fell, read why US coal power keeps declining. For what shale drilling means for local water, see fracking water use.