No, nuclear energy isn’t renewable, because it runs on uranium, which EIA classes as a nonrenewable energy source, but reactors made about 19% of US electricity in 2023 with very little carbon. Several state laws count it as clean energy next to wind and solar. The figures come mostly from EIA, the IPCC and the OECD Nuclear Energy Agency, and each one says the period it covers.
Top nuclear energy and renewability statistics
- EIA lists uranium as a nonrenewable energy source and says reactors use U-235, an isotope that’s relatively rare.
- The OECD Nuclear Energy Agency and IAEA counted more than 8.1 million tonnes of identified uranium resources on 1 January 2025.
- At the 64,500 tonnes a year reactors needed on that date, those resources work out to about 125 years of supply.
- UNECE put nuclear’s lifecycle emissions at 5.1 to 6.4 grams of CO2 equivalent per kWh in 2022.
- Nuclear made 9.0% of the world’s electricity in 2024, the lowest share in 45 years.
- About 19% of US electricity in 2023 came from nuclear and about 21% from renewables.
- Minnesota’s 2023 law requires 100% carbon-free electricity by 2040, counting nuclear alongside renewables.
- PNNL says the oceans hold more than four billion tons of uranium, and an Oak Ridge adsorbent has pulled out 5.2 grams per kilogram in 49 days.
- India’s Prototype Fast Breeder Reactor reached first criticality on 6 April 2026.
How do official bodies classify nuclear energy?
EIA lists nuclear as its own primary energy source, apart from fossil fuels and renewables, and the UN defines renewable energy as energy from natural sources that nature refills faster than people use it. Wind and sunlight make the usual list of renewables, and uranium isn’t on EIA’s list.
| Body | How it treats nuclear | Basis |
|---|---|---|
| EIA | Uranium is nonrenewable | Energy Explained |
| EIA, on state programs | Clean energy standards may include nuclear | Portfolio standards page |
| EU Taxonomy | Transitional activity under strict conditions | Parliament vote, 6 July 2022 |
| Virginia | Carbon-free energy includes nuclear | Code section 1-208.1 |
| Minnesota | Counts toward 100% carbon-free by 2040 | SF 4, 2023 |
Source: EIA, Nuclear explained, EIA, Renewable portfolio and clean energy standards, European Commission, Code of Virginia, Clean Energy States Alliance and EIA’s U.S. energy facts page.
The EU label is for investors. The Commission said the act ensures private investments in gas and nuclear meet strict criteria, and it sits apart from the EU’s renewables count, which reached 47.2% of EU electricity production in 2025. Reactors that qualify are part of Europe’s wider nuclear power outlook.
Which US states count nuclear as clean energy?
EIA says over half of US states have standards or voluntary goals for renewable or clean energy, and no federal standard exists. The wording of each law decides whether a reactor counts.
| State | Law | Target | Nuclear |
|---|---|---|---|
| Minnesota | SF 4, 2023 | 100% carbon-free by 2040 | Counts |
| Virginia | Code 1-208.1 | Clean energy definition | Included |
| Illinois | SB2408, 2021 | 100% clean energy by 2050 | Zero Emission Credits program |
| New York | Clean Energy Standard | Zero-emissions electricity by 2040 | Existing plants eligible |
| Vermont | H289, 2024 | 100% renewable by 2035 | Standard is labeled renewable |
Source: Clean Energy States Alliance, Table of 100% Clean Energy States, Code of Virginia and National Governors Association, 2019. The New York and Illinois nuclear entries rest on the NGA paper.
New York was the first state to include existing nuclear generation as an eligible resource, and Illinois adopted a similar approach with Zero Emission Credits. Illinois has 11 reactors, the most of any state, so if you live there, the Zero Emission Credits program covers plants near you. If your utility advertises a “clean” plan, check whether your state’s law says clean or renewable, because the two words can count different plants.
How much uranium is left?
The OECD Nuclear Energy Agency and IAEA put identified uranium resources at more than 8.1 million tonnes on 1 January 2025, up 2.1% on the previous edition.
| Measure | Value | Date |
|---|---|---|
| Identified resources, below USD 260/kgU (tU) | More than 8,100,000 | 1 January 2025 |
| Identified resources, below USD 130/kgU (tU) | 5,864,500 | 1 January 2025 |
| Identified resources, USD 40 to 260/kgU (tU) | 7,934,500 | 1 January 2023 |
| Reactor use per year (tU) | 64,500 | 1 January 2025 |
| Projected use per year, 2050 low case (tU) | 84,800 | 2050 |
| Projected use per year, 2050 high case (tU) | 143,900 | 2050 |
| Years of supply at today’s use | About 125 | Computed |
| Years of supply at 2050 high-case use | About 56 | Computed |
Source: OECD Nuclear Energy Agency, Uranium 2026 release, World Nuclear Association and OECD Nuclear Energy Agency, Uranium 2024 release. The two year figures are computed from those inputs.
The cost cut-off changes the total. Resources recoverable below USD 130 per kilogram are 5,864,500 tonnes, and the larger figure adds ore that costs more to dig out. Neither number is a depletion date, because both count deposits that have already been identified.
The Red Book’s own version of the question uses cumulative demand. If capacity stayed at its 2050 level, demand could pass the roughly 8 million tonne resource base by the 2080s in the low-growth case or the 2110s in the high-growth case. A 2016 Scientific American article quoted a DOE official at 100 to 200 years, an older and looser estimate that sits in the same range.
The table below follows uranium output and exploration spending. A new uranium project takes 15 to 20 years to develop, so output can’t jump to match a bigger fleet.
| Year | Mine production (tU) | Exploration and development spending (USD million) |
|---|---|---|
| 2020 | n/a | 380 |
| 2022 | 49,490 | 800 |
| 2023 | 54,345 | 840 (preliminary) |
| 2024 | 61,924 | n/a |
Source: World Nuclear News, 2025, World Nuclear News, 2026 and American Nuclear Society. Production of 61,924 tU in 2024 was the highest since 2006.
Can breeder reactors make nuclear effectively renewable?
DOE says fast reactors that continuously recycle their fuel would need 100 times less uranium for the same energy as water-cooled reactors. The same page says recycling could cut waste by 90%. That’s a ceiling for the technology, and few machines have tried to reach it.
| Reactor | Country | Milestone | Date |
|---|---|---|---|
| Experimental Breeder Reactor-II | United States | Ceased operations | 1994 |
| BN-800 | Russia | First criticality | June 2014 |
| BN-800 | Russia | Full MOX core | Since 2022 |
| Prototype Fast Breeder Reactor | India | Construction began | 2004 |
| Prototype Fast Breeder Reactor | India | First criticality | 6 April 2026 |
Source: US DOE, Experimental Breeder Reactor-II, US DOE, Quadrennial Technology Review 2015, World Nuclear Association, Russia, World Nuclear Association, India and Press Information Bureau of India.
The World Nuclear Association counts about 20 fast neutron reactors that have operated, and says that by the 1980s they weren’t commercially competitive with light water reactors. India’s government says that once the Kalpakkam reactor is fully operational the country will be the second after Russia to run a commercial fast breeder. The International Panel on Fissile Materials called the plant’s delays and cost escalations illustrative of fast breeders elsewhere.
Recycling is also a policy question. EIA says reprocessing spent fuel isn’t permitted in the United States.
Can uranium from seawater make nuclear renewable?
PNNL says the oceans hold more than four billion tons of uranium, enough for 10,000 years of global needs. That’s how much is dissolved in the water, and it’s far above the 57 million tonnes of unconventional resources the Red Book counts as potential supply.
An Oak Ridge adsorbent tested by PNNL held 5.2 grams of uranium per kilogram after 49 days in natural seawater. A DOE official called the process still inefficient and expensive in 2016. PNNL describes half a century of research with limited success, and its release gives no commercial cost per kilogram.
How much carbon does nuclear energy produce?
The IPCC’s 2014 review puts nuclear’s lifecycle median at 12 grams of CO2 equivalent per kWh, against 820 for coal. That counts mining, building and fuel supply along with the plant.
| Source | Minimum (g CO2e/kWh) | Median (g CO2e/kWh) | Maximum (g CO2e/kWh) |
|---|---|---|---|
| Coal | 740 | 820 | 910 |
| Gas, combined cycle | 410 | 490 | 650 |
| Biomass, dedicated | 130 | 230 | 420 |
| Solar PV, utility | 18 | 48 | 180 |
| Solar PV, rooftop | 26 | 41 | 60 |
| Geothermal | 6.0 | 38 | 79 |
| Concentrated solar | 8.8 | 27 | 63 |
| Hydropower | 1.0 | 24 | 2,200 |
| Wind, offshore | 8.0 | 12 | 35 |
| Nuclear | 3.7 | 12 | 110 |
| Wind, onshore | 7.0 | 11 | 56 |
Source: IPCC, AR5 Working Group III, Annex III, Table A.III.2. Values include the albedo effect and are from 2014 literature.
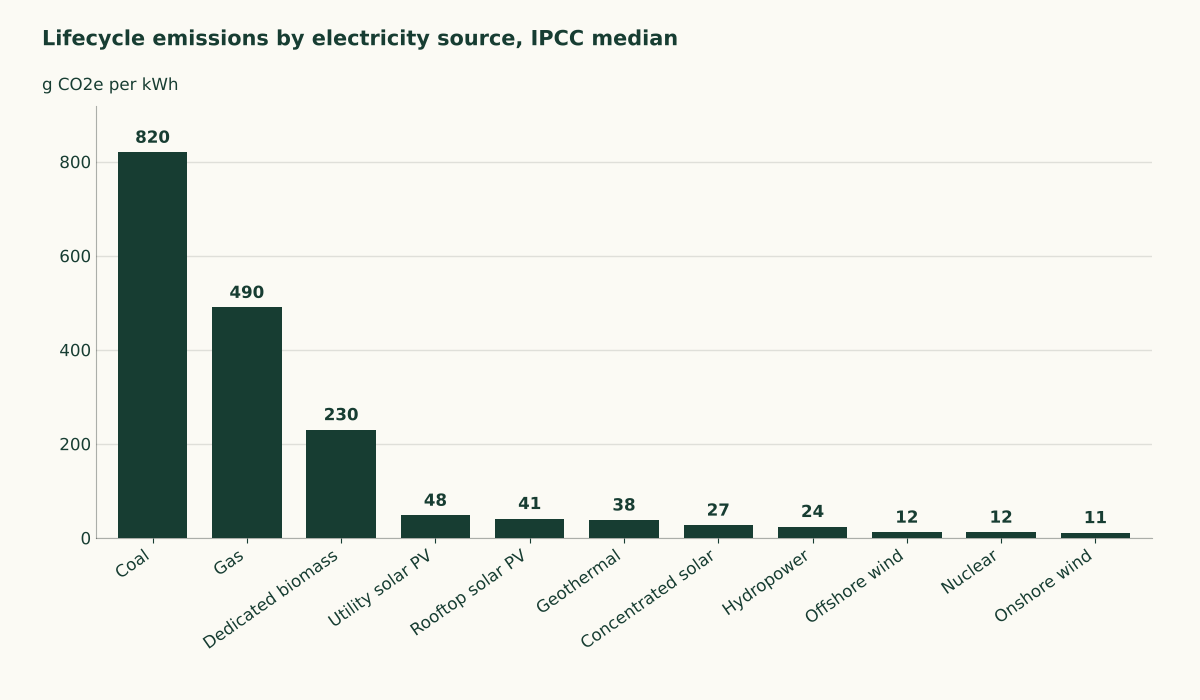
Nuclear’s median sits level with wind and well below utility solar. If you’re weighing a rooftop array on your own house, its median in the table is about three times a reactor’s. UNECE’s 5.1 to 6.4 is lower again, and the two come from different studies, a worldwide literature range and a UNECE-region assessment, so they don’t have to match.
EIA says reactors produce no carbon dioxide while operating, and that the major environmental concern is radioactive waste. Waste and accidents are the questions behind whether nuclear power is safe. A renewable label doesn’t settle carbon either. Dedicated biomass sits at a median of 230 grams in the table above, a case where biomass counts as renewable and still emits far more than a reactor.
Why do people group nuclear with renewables?
The two cover similar ground on the grid. In 2023, utility-scale US generation was about 19% nuclear and 21% renewable, and EIA says the two generally have similar shares of US energy production. Worldwide, low-carbon sources together reached 40.9% of electricity in 2024.
The US had 94 operating reactors in March 2026 at nuclear power plants in 28 states. Ember reported that solar overtook wind and drew close to nuclear in 2025.
Solar generation rose by 636 TWh to 2,778 TWh in 2025, up 30%. Ember expects both solar and wind to pass nuclear in 2026.
Where these numbers come from
We computed two figures. The 125 years divides 8.1 million tonnes of resources by 64,500 tonnes of annual use. The 56 years divides the same resources by the 143,900 tonne high case for 2050.
Both treat the resource as fixed and demand as flat, and the longer figure is a floor because the report says resources exceed that total. The Red Book comes out about every two years, and this page will update when the next one lands.
Where sources disagree, the page gives both. The World Nuclear Association puts reactor use at nearly 69,000 tonnes a year, against 64,500 in the Red Book. WNA counts a larger fleet, and it lists stockpiles and recycling as supply beyond mining. The lifecycle table uses the IPCC’s 2014 ranges, and the UNECE range comes through WNA.
Renewable by law in some states, clean by law in others
Nuclear stays nonrenewable by EIA’s definition, because the uranium it burns is mined from deposits that are large but finite. What varies is the policy label. Minnesota’s carbon-free standard counts reactors toward its goal, while Vermont’s target is written as renewable and leaves them out. Whether a reactor near you counts toward your state’s goal comes down to which of those two words the law uses.
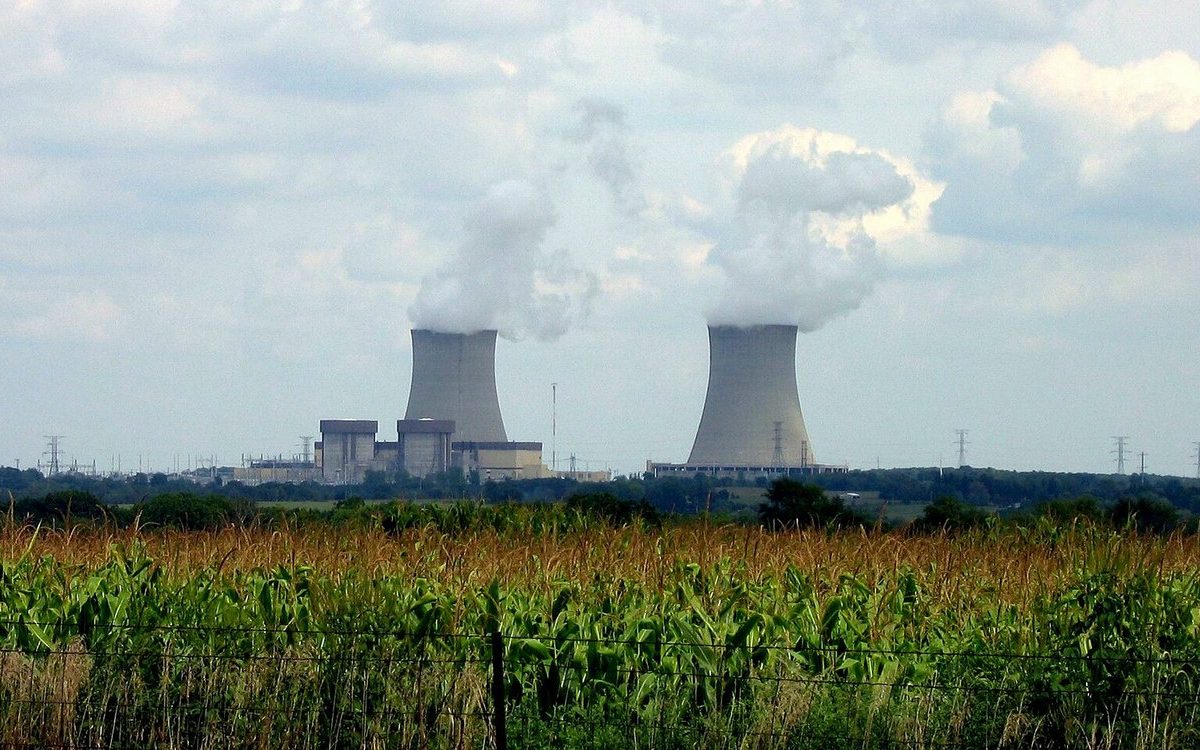
Top photo: en:User:Jbs666, CC BY-SA 3.0, via Wikimedia Commons, cropped.