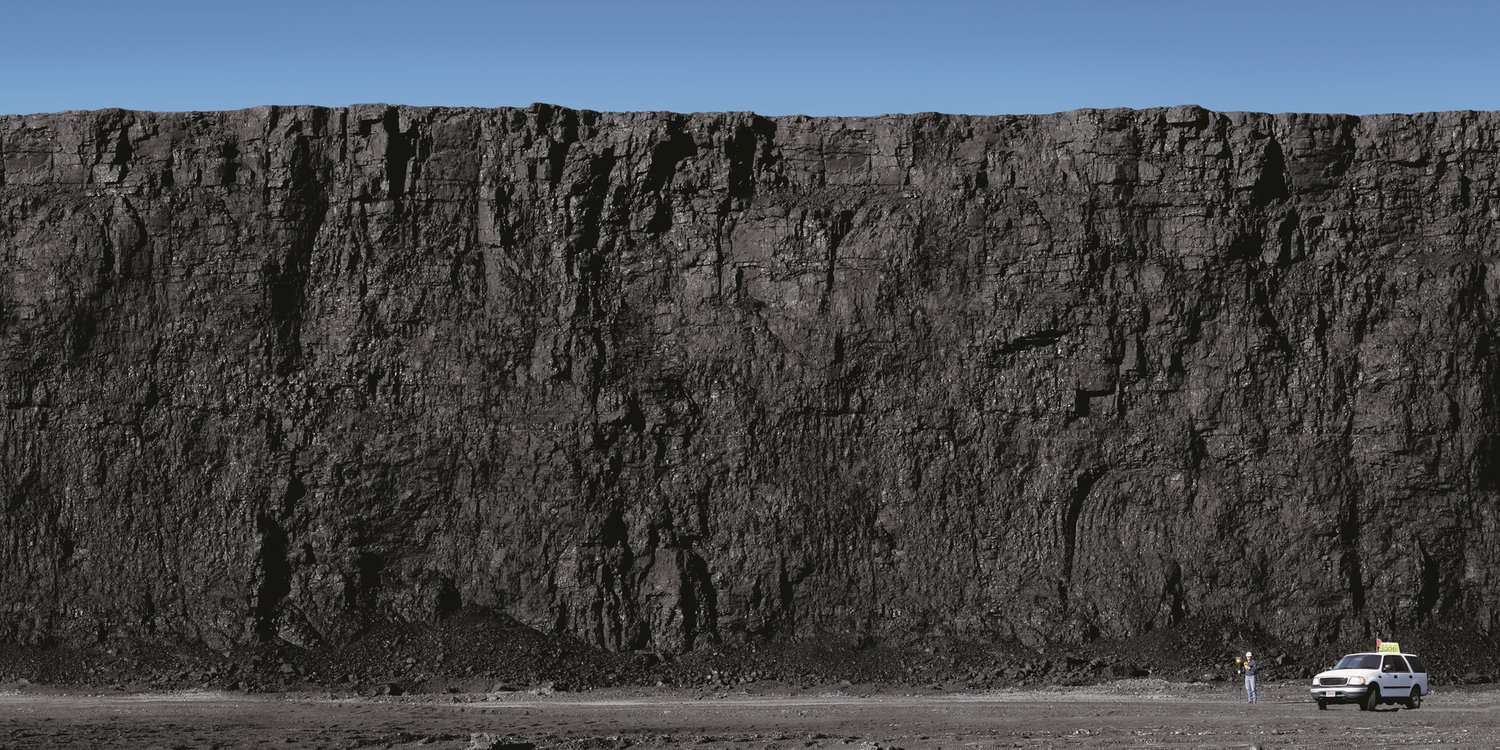
Coal forms when swamp plants are buried and heated for millions of years, and most coals are between 60 million and 300 million years old. The deeper the coal was buried, the higher its rank, from lignite at the bottom to anthracite at the top. The US mined 512.5 million short tons of coal in 2024. The figures below come from EIA, the US Geological Survey and state geological surveys, and each one says the period it covers.
Top coal statistics
- The Carboniferous Period lasted about 359.2 to 299 million years ago, and in the US its Pennsylvanian stage holds the coal-bearing layers, says the UC Berkeley Museum of Paleontology.
- Anthracite holds about twice the heat of lignite, about 15,000 Btu per pound against 7,000, according to USGS.
- In 2024, Wyoming mined 190.7 million short tons, which is 37.2% of the US total.
- US coal output peaked at 1,171.8 million short tons in 2008 and was 528.4 million in 2025.
- The US has the most proved coal reserves of any country, about 21% of the world total, says Stanford’s energy hub.
- EIA estimates US recoverable coal reserves at 249.4 billion short tons as of January 1, 2025.
How is coal formed?
Coal forms when swamp plants pile up as peat and then spend millions of years buried and heated. In Pennsylvania, the coal-forming plants first piled up about 320 million years ago, says the Pennsylvania Geological Survey.
The process starts with peat. USGS describes it as loosely consolidated layers of plant and mineral matter that build up in wetlands. Penn State’s coal outreach page says plants in oxygen-poor swamp water don’t rot away, since normal decay needs oxygen. In the Pennsylvanian swamps, plant material did not decay when the seas covered it.
Sediment then buries the peat. The Kentucky Geological Survey says the weight squeezes out much of the water from the peat and shrinks its volume.
How much plant debris makes a foot of coal depends on who you ask. North Dakota’s state history site says 10 feet of decayed vegetation make 1 foot of coal. Stanford’s energy hub says 20 meters of woody plant material make a 1-meter seam. Neither shows a method, and no geological survey page we opened gives a figure.
Heat does the rest of the work. The earth warms about 1 degree Fahrenheit for every 70 to 100 feet of depth, and the survey calls heating the primary control on how far coal advances.
Some of the original peat survives inside the finished coal. The Illinois State Geological Survey calls the stone lumps of fossil peat found in its coal seams coal balls. If a stream near you cuts into an Illinois coal bed, the survey says erosion can uncover them, and a fresh one looks like a rounded, dull brown rock crusted with coal.
What is coal made of?
The Pennsylvania Geological Survey’s table of example samples shows carbon rising from 59.0% in peat to 94.0% in Pennsylvania anthracite while the oxygen column falls the other way.
| Stage and example | Carbon (%) | Oxygen (%) | Hydrogen (%) | Heating value (Btu per pound) |
|---|---|---|---|---|
| Wood | 49.2 | 44.5 | 6.3 | 6,500 |
| Peat | 59.0 | 35.0 | 6.0 | 4,500 |
| Lignite (North Dakota) | 72.0 | 22.5 | 5.5 | 7,000 |
| Subbituminous (Wyoming) | 78.0 | 16.5 | 5.5 | 9,300 |
| High-volatile bituminous (Illinois) | 82.0 | 12.5 | 5.5 | 11,250 |
| High-volatile bituminous (Pittsburgh, Pa.) | 87.5 | 7.0 | 5.5 | 13,850 |
| Low-volatile bituminous (Broad Top, Pa.) | 91.5 | 4.0 | 4.5 | 14,350 |
| Anthracite (Pennsylvania) | 94.0 | 3.0 | 3.0 | 13,600 |
| Graphite (Chester, Pa.) | 100.0 | 0.0 | 0.0 | n/a |
Source: Pennsylvania Geological Survey, Coal in Pennsylvania (Educational Series 7), adapted from a 1928 table. Each row is a single example sample.
Coal isn’t pure plant matter. Penn State’s coal outreach page says coal is not pure organic material, because minerals wash into the swamp and the plants carry their own ash.
How long does coal take to form, and how hot does it get?
Coal takes millions of years, and the US mines coal that formed more than 290 million years ago in West Virginia and about 60 million years ago in the Powder River Basin. West Virginia’s land kept sinking for more than 50 million years while swamps laid down its coal seams.
| Region | Main rank mined | Coal-forming period | Age (million years) |
|---|---|---|---|
| West Virginia | Bituminous | Pennsylvanian | more than 290 |
| Illinois | Bituminous | Pennsylvanian | not stated |
| Powder River Basin (Wyoming, Montana) | Subbituminous | Paleogene | about 60 |
| North Dakota | Lignite | Cenozoic | under about 65 |
Source: e-WV, Illinois State Geological Survey, Wyoming State Geological Survey, Mining Technology and NDStudies.gov for the ages, and EIA’s Annual Coal Report 2024, Table 6 for the rank. North Dakota’s page says the last seas drained away early in the Cenozoic, which began about 65 million years ago, and gives no single age for the lignite. Illinois’s page gives the Pennsylvanian period and no age in years.
A PNAS commentary says the highest rates of organic carbon burial in the past half billion years came 330 to 260 million years ago, in large part from peat buried in broad tropical lowland basins.
The sources disagree on the age of western coal. EIA’s Energy Kids page says most US subbituminous coal is at least 100 million years old. The University of Calgary’s Energy Education site puts extensive coal deposits in the Cretaceous, 65 to 144 million years ago.
Wyoming’s geological survey says most of the state’s Paleogene coals are subbituminous, and Mining Technology dates the basin’s beds to about 60 million years ago. The table follows the Wyoming and Powder River dates, which name both the period and the basin.
The sources also disagree on what does the work. EIA says the rank of a deposit is determined by the pressure and heat that acted on the plants. Kentucky’s survey says pressure is a minor influence, and Wikipedia’s coal article says temperature is much more important than pressure or time of burial.
Temperatures by rank are harder to find. Wikipedia’s coal article says subbituminous coal can form at as low as 35 to 80 degrees Celsius. It puts anthracite at at least 180 to 245 degrees Celsius. No survey or federal page we opened gives figures, so treat both as one source’s numbers.
What are the four ranks of coal?
EIA sorts coal into four ranks, with lignite at the bottom and anthracite at the top. The table gives each rank’s carbon content, heating value and share of 2024 US output.
| Rank | Carbon (%) | Heating value (Btu per pound) | Share of 2024 US production (%) |
|---|---|---|---|
| Lignite | 25 to 35 | 4,000 to 8,300 | 7.8 |
| Subbituminous | 35 to 45 | 8,300 to 13,000 | 43.2 |
| Bituminous | 45 to 86 | 10,500 to 15,000 | 48.4 |
| Anthracite | 86 to 97 | nearly 15,000 | 0.6 |
Source: EIA, Coal explained for carbon, NDStudies.gov for heating value, and shares computed from EIA’s Annual Coal Report 2024, Table 6.
The carbon figures here don’t match the Pennsylvania survey’s samples above. EIA’s ranges run lower than the survey’s examples for the same ranks, and EIA doesn’t say what basis its percentages use, so each stays in its own table.
The US average sits between the ranks. EIA reports that coal produced in the US averaged 20.383 million Btu per short ton in 2025, which works out to about 10,190 Btu per pound at 2,000 pounds per short ton.
Lignite stays close to home. If you live in lignite country, the power plant down the road probably burns it, and EIA says producers sell lignite almost exclusively to power plants near the mines.
Anthracite is the smallest rank. Pennsylvania’s 40 anthracite mines produced 2,958 thousand short tons in 2024.
Where does coal come from in the US?
Bituminous coal comes mainly from the Appalachian and Illinois Basins, subbituminous coal from the Powder River Basin in Wyoming and Montana, and lignite from the Midwest, mostly North Dakota and Texas. The table lists ten coal states by output.
| State | 2024 (million short tons) | 2023 (million short tons) | Main rank |
|---|---|---|---|
| Wyoming | 190.7 | 237.3 | Subbituminous |
| West Virginia | 79.5 | 84.6 | Bituminous |
| Pennsylvania | 40.6 | 42.6 | Bituminous |
| Illinois | 34.2 | 36.9 | Bituminous |
| Montana | 27.0 | 29.1 | Subbituminous |
| North Dakota | 25.4 | 24.1 | Lignite |
| Kentucky | 24.3 | 28.3 | Bituminous |
| Indiana | 20.1 | 23.8 | Bituminous |
| Alabama | 14.4 | 12.0 | Bituminous |
| Texas | 12.3 | 13.8 | Lignite |
| US total (including refuse recovery) | 512.5 | 578.0 |
Source: EIA, Annual Coal Report 2024, Tables 1 and 6. Pennsylvania’s total includes 3.0 million short tons of anthracite.
According to EIA’s 2022 ranking, the two largest US mines are both in Wyoming. Peabody reports that North Antelope Rochelle produced 65 million tons of coal in 2025 and holds 1.23 billion tons of proven and probable reserves.
How much of each kind of coal does the US mine?
Bituminous coal led in 2024 at 248.0 million short tons, ahead of 221.5 million for subbituminous. The table below runs year by year.
| Year | Bituminous (million short tons) | Subbituminous (million short tons) | Lignite (million short tons) | Anthracite (million short tons) |
|---|---|---|---|---|
| 2000 | 574.3 | 409.2 | 85.6 | 4.6 |
| 2001 | 611.3 | 434.4 | 80.0 | 1.9 |
| 2002 | 572.1 | 438.4 | 82.5 | 1.4 |
| 2003 | 541.5 | 442.6 | 86.4 | 1.3 |
| 2004 | 561.5 | 465.4 | 83.5 | 1.7 |
| 2005 | 571.2 | 474.7 | 83.9 | 1.7 |
| 2006 | 561.6 | 515.3 | 84.2 | 1.5 |
| 2007 | 542.8 | 523.7 | 78.6 | 1.6 |
| 2008 | 555.3 | 539.1 | 75.7 | 1.7 |
| 2009 | 504.1 | 496.4 | 72.5 | 1.9 |
| 2010 | 489.5 | 514.8 | 78.2 | 1.8 |
| 2011 | 526.0 | 486.3 | 81.1 | 2.2 |
| 2012 | 485.4 | 449.8 | 78.9 | 2.4 |
| 2013 | 471.2 | 434.3 | 77.2 | 2.1 |
| 2014 | 480.0 | 438.6 | 79.5 | 1.9 |
| 2015 | 404.4 | 419.5 | 70.9 | 2.1 |
| 2016 | 325.1 | 330.2 | 71.3 | 1.7 |
| 2017 | 353.5 | 351.5 | 67.7 | 1.9 |
| 2018 | 357.2 | 340.0 | 57.0 | 1.9 |
| 2019 | 339.0 | 311.6 | 53.2 | 2.6 |
| 2020 | 237.9 | 245.8 | 49.4 | 2.4 |
| 2021 | 259.9 | 268.1 | 47.4 | 2.1 |
| 2022 | 270.5 | 273.6 | 47.5 | 2.5 |
| 2023 | 263.1 | 271.1 | 40.9 | 2.9 |
| 2024 | 248.0 | 221.5 | 40.0 | 3.1 |
Source: EIA, Annual Coal Report 2024, Table ES1. Bituminous and anthracite include a small amount of refuse recovery. EIA hasn’t published 2025 production by rank.
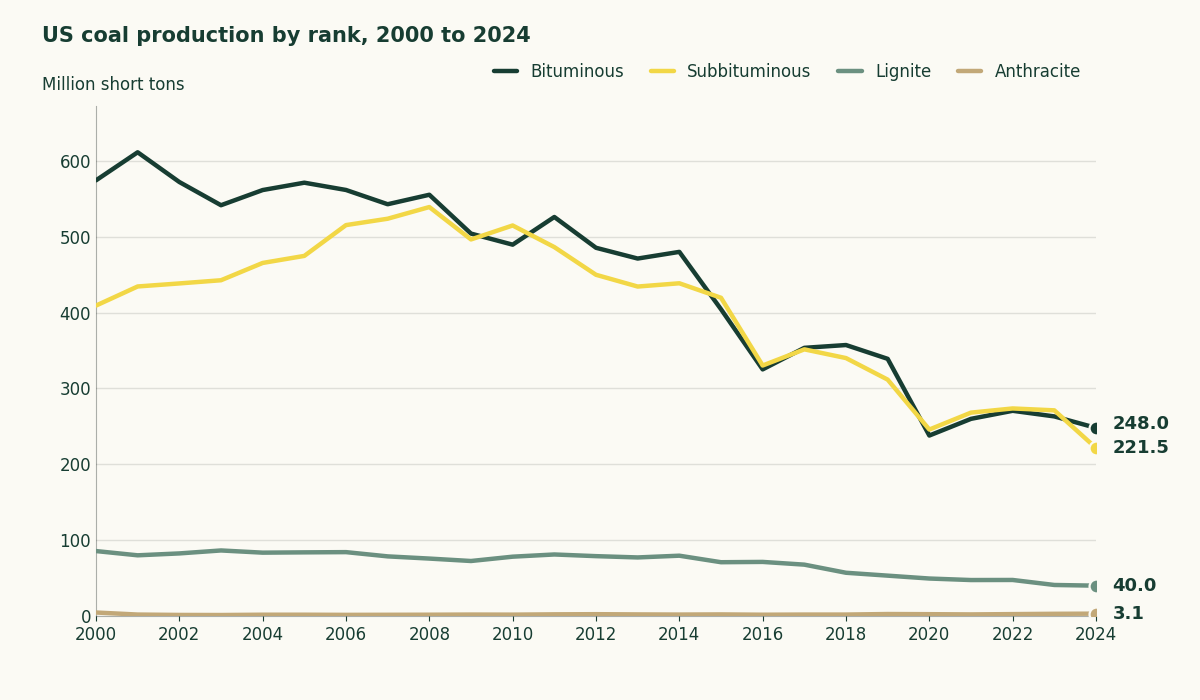
In EIA’s Table ES1, bituminous and subbituminous swap the lead in 2010, 2011, 2015, 2017, 2020 and 2024. Every rank fell in 2020, and lignite fell in eight of the ten years from 2015 to 2024. Anthracite stays the smallest rank in every year.
How much coal is left in the US?
The US demonstrated reserve base, which is coal identified to set levels of accuracy, held about 468 billion short tons on January 1, 2025. Not all of that can be mined. Recoverable reserves, which EIA gets by removing coal that can’t be reached and applying mining recovery rates, were 249,351 million short tons.
| State | Demonstrated reserve base (million short tons) | Estimated recoverable reserves (million short tons) | Recoverable reserves at producing mines (million short tons) |
|---|---|---|---|
| Montana | 118,277 | 74,226 | 315 |
| Illinois | 102,959 | 37,495 | 1,759 |
| Wyoming | 55,578 | 33,803 | 3,597 |
| West Virginia | 29,311 | 15,932 | 1,797 |
| Kentucky | 27,790 | 13,766 | 384 |
| Pennsylvania | 25,604 | 10,753 | 941 |
| Ohio | 22,779 | 11,231 | 34 |
| Colorado | 15,510 | 9,385 | 98 |
| New Mexico | 11,659 | 6,688 | 31 |
| Texas | 11,620 | 8,944 | 224 |
| US total | 468,350 | 249,351 | 10,593 |
Source: EIA, Annual Coal Report 2024, Table 15. Demonstrated reserve base as of January 1, 2025, and reserves at producing mines as of December 31, 2024.
The three states at the head of the reserves table hold 59.1% of the demonstrated reserve base, by arithmetic on the table. Montana holds the most coal in the ground, 25% of the base on January 1, 2023, yet it ranks fifth in output in the state table above.
If you’re wondering whether the US will run out, simple division gives about 486 years of recoverable reserves at the 2024 pace and about 21 years at producing mines. EIA does the same math and says the real number depends on changes in production and reserves estimates.
The last national USGS assessment, published in 1975, put US coal resources in the ground at 4 trillion short tons, and EIA says no newer national assessment exists.
How we sourced these numbers
The figures come from EIA’s Annual Coal Report for 2024, which holds final data for that year. EIA’s Coal explained pages still carry 2022 data, so definitions are all we took from them. The shares by rank, Wyoming’s share, the reserve percentage and the years of reserves are our arithmetic on EIA’s tables.
EIA counts in short tons of 2,000 pounds, and all tonnages here are short tons. The 2025 production total is from EIA’s Monthly Energy Review and can be revised. The history table ends at 2024, and EIA hasn’t published 2025 production by rank. We left out ages and ratios that a single non-survey source gives, unless the text names the source.
What EIA expects the US to mine in 2026 and 2027
EIA’s Short-Term Energy Outlook of September 2026 expects US coal production of 516 million short tons in 2026 and 497 million in 2027, down from 528 million in 2025. It also forecasts coal-fired generation falling 8% in 2026 and 6% in 2027. Both are forecasts, and EIA’s next outlook is due in October 2026.
The decline of coal on the US grid is tracked on its own page. For coal beside oil and gas, see the types of fossil fuels, and for a country that leaned on coal after closing its reactors, see Germany’s nuclear phase-out. The reserves table above shows how far apart the two measures sit. When you next see a US coal reserves number, check whether it’s the demonstrated reserve base or the much smaller figure for working mines.
Top photo: Peabody Energy, Inc., CC BY 3.0, via Wikimedia Commons, cropped.