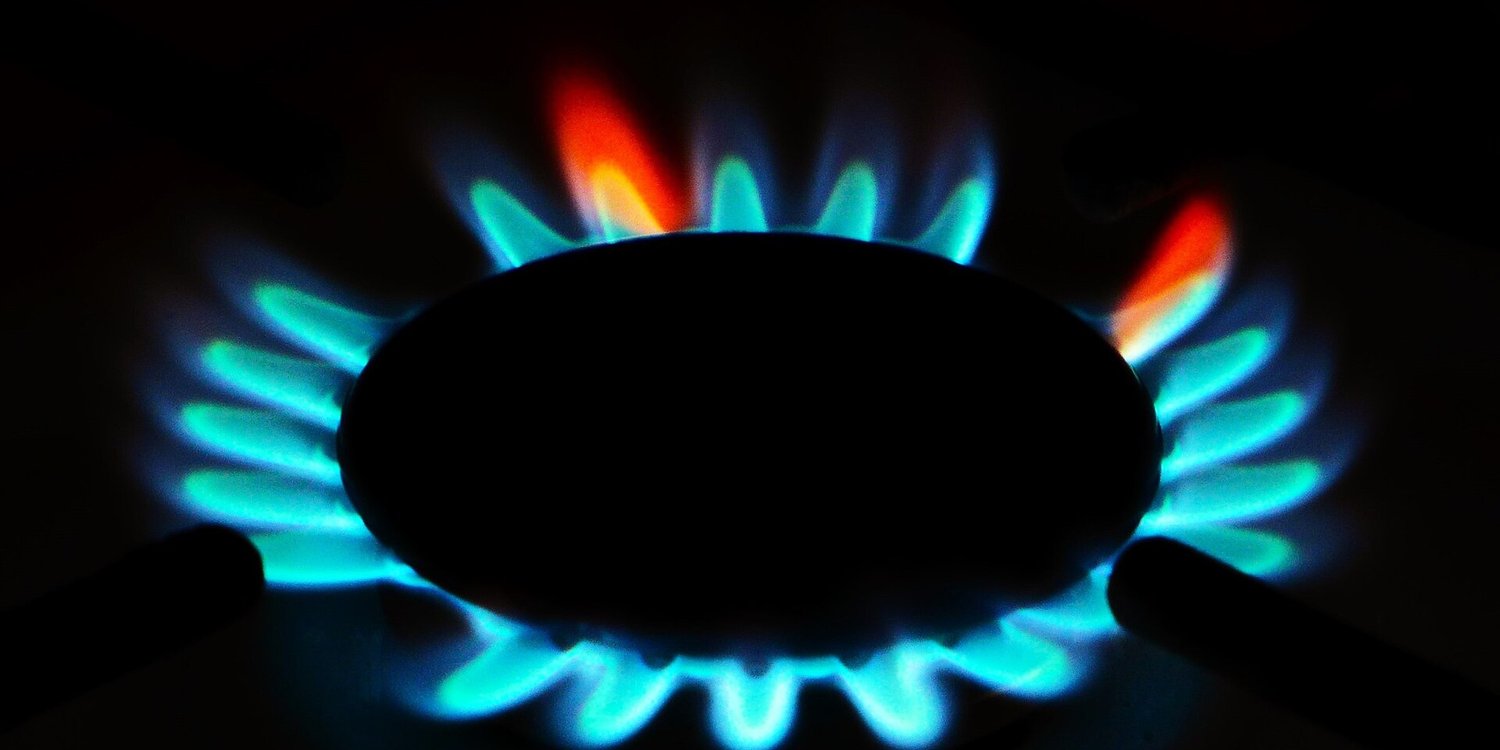
Natural gas is a fossil fuel that made 40% of US electricity in 2025, and the US produced a record 39.29 trillion cubic feet (Tcf) of dry gas that year. Gas was also used in 58% of US homes in 2020, so it shows up in both your power bill and your heating bill. The figures below come mostly from the US Energy Information Administration (EIA), with the Department of Energy, EPA, the International Energy Agency and a peer-reviewed study filling in, and they describe 2025 unless a line says otherwise.
Top natural gas statistics
- Dry natural gas production hit a record 39 trillion cubic feet in 2025, more than 4% above 2024.
- The US produced 25.6% of the world’s natural gas in 2025 by energy content, more than any other country, in Energy Institute data.
- Power plants were the biggest users, burning 13.05 Tcf in 2025, or 38.9% of all US gas use.
- LNG exports (liquefied natural gas, gas chilled into a liquid for shipping) reached 5.51 Tcf in 2025, up from 0.19 Tcf in 2016.
- In January 2026, natural gas prices averaged $7.72 per million Btu during Winter Storm Fern.
- The average US home paid $15.34 per thousand cubic feet in 2025, up from $10.78 in 2020, before inflation.
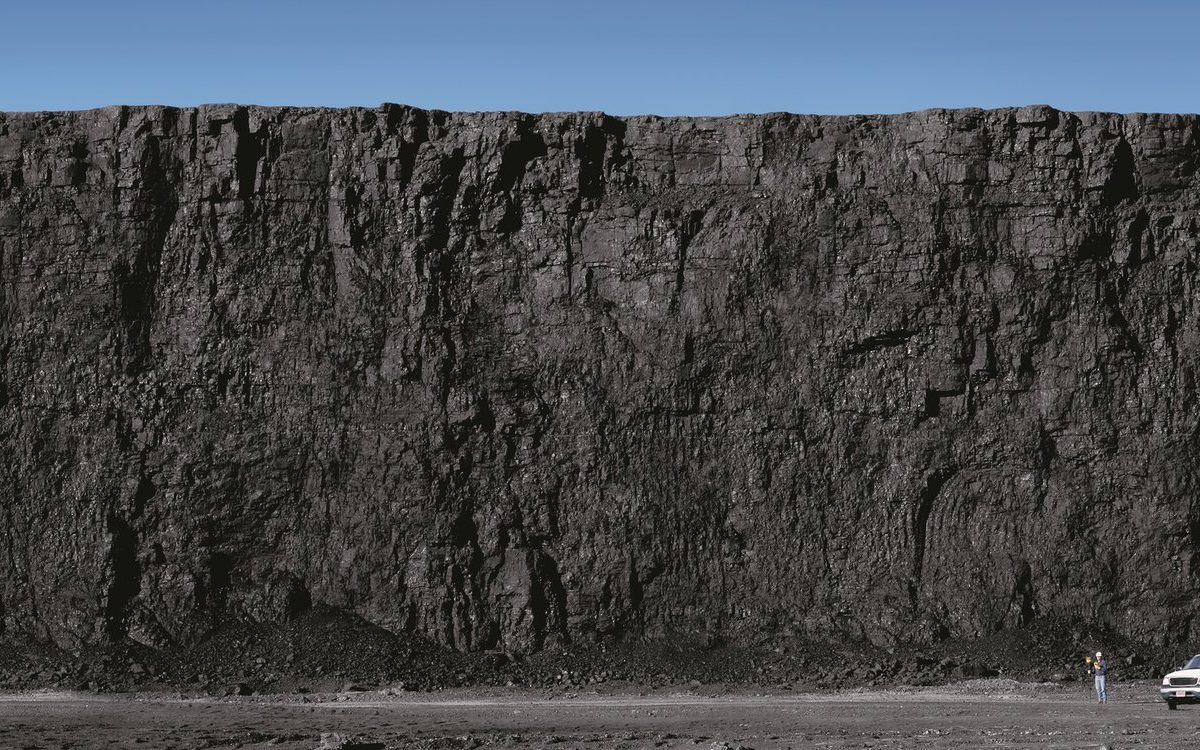
- Burning gas releases 45% less CO2 than burning coal for the same energy, a share computed from EIA’s emission coefficients.
- Aerial surveys of six US oil and gas regions found methane losses averaging 2.43% of covered gas production, roughly three times the government inventory estimate.
- The Department of Energy (DOE) counted 18.65 Bcf/d of LNG export capacity operating and 15.05 Bcf/d under construction on December 31, 2025, where Bcf/d means billion cubic feet per day.
What is natural gas?
Natural gas is a fossil fuel whose largest component is methane, a molecule with one carbon atom and four hydrogen atoms. Wikipedia notes it’s also called methane gas or fossil gas.
On its own, natural gas is colorless, odorless and tasteless, so gas companies add mercaptan to give it a distinct and unpleasant odor, which helps people detect leaks in pipelines. If you’ve smelled gas in a kitchen or near a meter, that smell was the additive.
Where does natural gas come from, and where is it found?
Natural gas comes from the remains of plants and animals that piled up in thick layers millions of years ago, and pressure and heat later changed some of that buried material into natural gas.
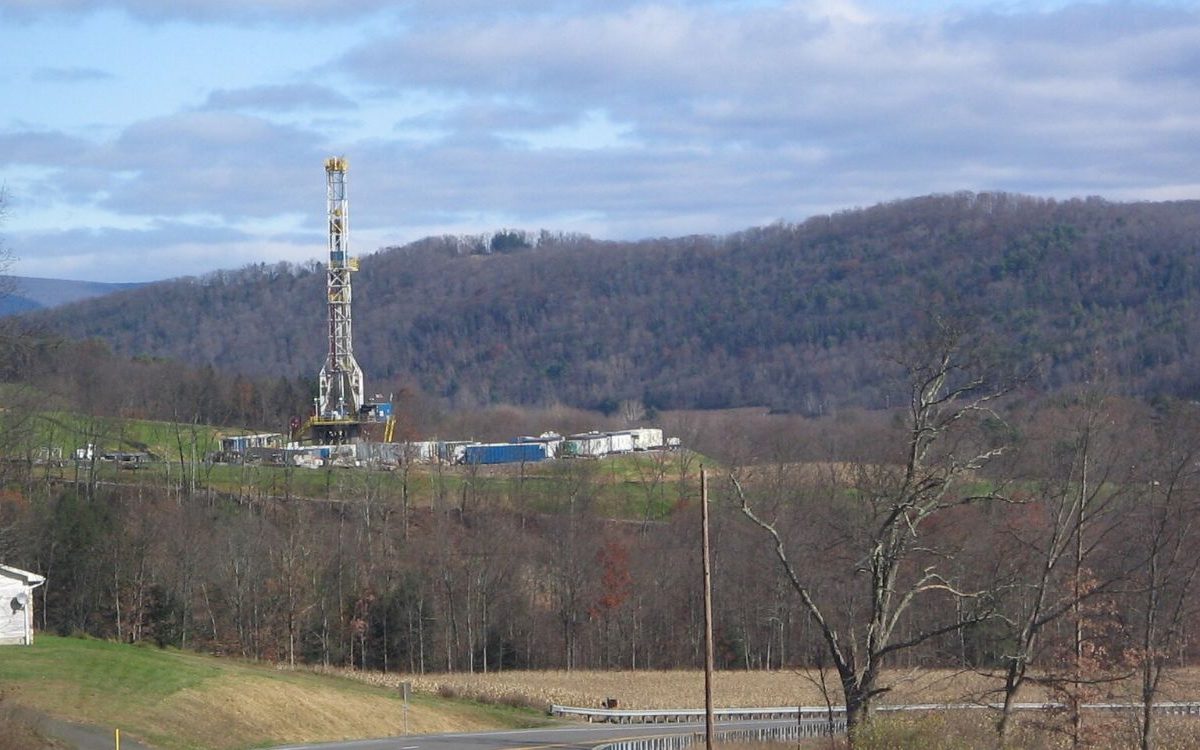
Large-scale shale gas production began around 2000 in the Barnett Shale of north central Texas, and EIA says the Marcellus shale in Ohio, Pennsylvania and West Virginia is the largest source of shale gas. For how those wells are drilled, see how fracking works, and the shale gas page covers how that output grew.
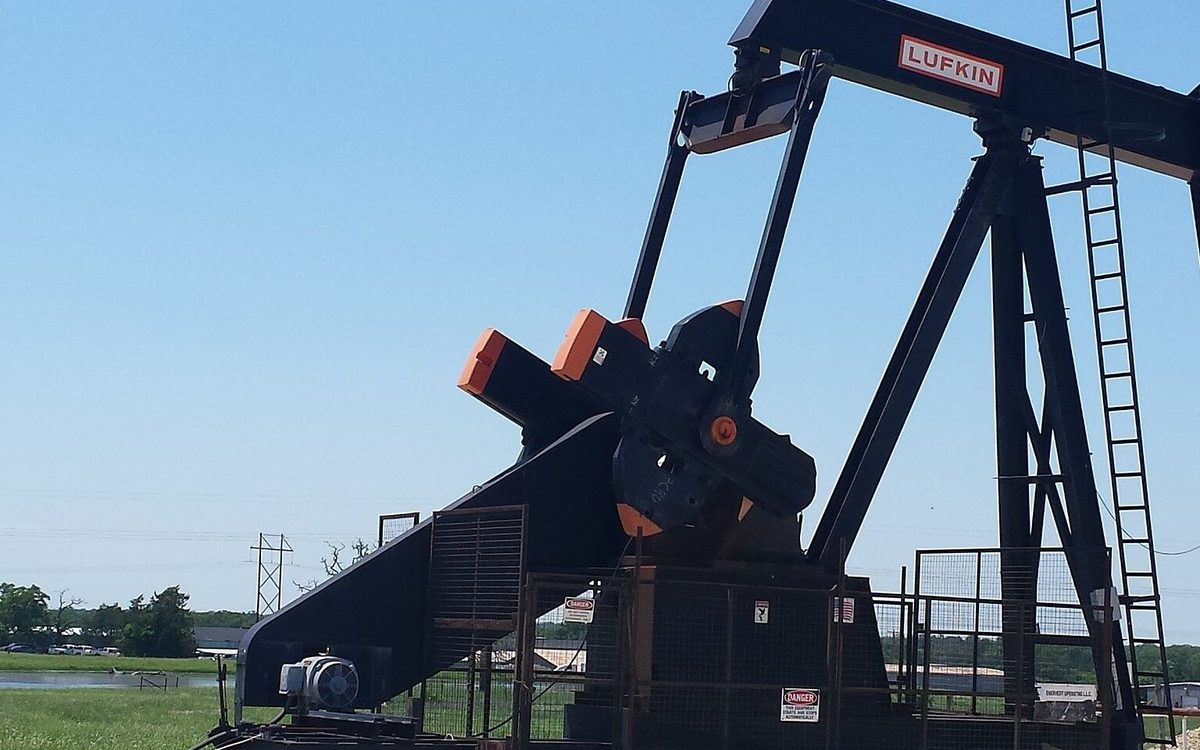
Oil wells bring gas up too. In the Permian region of Texas and New Mexico, gas production is driven primarily by associated gas produced during crude oil extraction, and EIA forecasts 29.2 Bcf/d there in 2026. Gas taken from coal seams is called coalbed methane, and it made about 2% of US dry gas production in 2022.
Texas produced 12.66 Tcf of marketed gas in 2025, which is 29.3% of the US total. Pennsylvania came second.
| State | 2020 marketed production (Tcf) | 2025 marketed production (Tcf) | Share of US 2025 (%) |
|---|---|---|---|
| Texas | 9.81 | 12.66 | 29.3 |
| Pennsylvania | 7.17 | 7.68 | 17.8 |
| New Mexico | 1.97 | 4.13 | 9.6 |
| Louisiana | 3.21 | 3.81 | 8.8 |
| West Virginia | 2.57 | 3.60 | 8.3 |
| Oklahoma | 2.67 | 2.88 | 6.7 |
| Ohio | 2.39 | 2.10 | 4.9 |
| Colorado | 2.00 | 1.87 | 4.3 |
| North Dakota | 0.89 | 1.20 | 2.8 |
| Wyoming | 1.21 | 0.94 | 2.2 |
Source: EIA, Natural Gas Gross Withdrawals and Production, marketed production by state. Shares are computed from the US total on the same page, and the ten states listed make up 94.5% of it.
Marketed production is a wider EIA measure than the dry production used in the other tables, which is why the US total in the table is 43.23 Tcf. New Mexico’s output rose from 1.97 Tcf in 2020 to 4.13 Tcf in 2025, more than double.
How much natural gas does the US produce, use and export?
The US used 33.52 Tcf of natural gas in 2025 and exported 8.97 Tcf, counting pipelines and LNG. Imports were 3.16 Tcf, so net exports came to 5.80 Tcf by subtraction.
| Year | Dry production (Tcf) | Consumption (Tcf) | Exports (Tcf) | LNG exports (Tcf) |
|---|---|---|---|---|
| 2005 | 18.05 | 22.01 | 0.73 | 0.07 |
| 2006 | 18.50 | 21.70 | 0.72 | 0.06 |
| 2007 | 19.27 | 23.10 | 0.82 | 0.05 |
| 2008 | 20.16 | 23.28 | 0.96 | 0.04 |
| 2009 | 20.62 | 22.91 | 1.07 | 0.03 |
| 2010 | 21.32 | 24.09 | 1.14 | 0.06 |
| 2011 | 22.90 | 24.48 | 1.51 | 0.07 |
| 2012 | 24.03 | 25.54 | 1.62 | 0.03 |
| 2013 | 24.21 | 26.16 | 1.57 | 0.00 |
| 2014 | 25.89 | 26.59 | 1.51 | 0.02 |
| 2015 | 27.07 | 27.24 | 1.78 | 0.03 |
| 2016 | 26.59 | 27.44 | 2.34 | 0.19 |
| 2017 | 27.34 | 27.14 | 3.15 | 0.71 |
| 2018 | 30.77 | 30.14 | 3.61 | 1.08 |
| 2019 | 33.90 | 31.13 | 4.66 | 1.82 |
| 2020 | 33.81 | 30.60 | 5.28 | 2.39 |
| 2021 | 34.53 | 30.65 | 6.65 | 3.56 |
| 2022 | 36.25 | 32.29 | 6.91 | 3.87 |
| 2023 | 37.65 | 32.59 | 7.61 | 4.34 |
| 2024 | 37.72 | 33.06 | 7.71 | 4.37 |
| 2025 | 39.29 | 33.52 | 8.97 | 5.51 |
Source: EIA, Dry Natural Gas Production, Natural Gas Total Consumption, Natural Gas Exports and Liquefied Natural Gas Exports, annual data released September 30, 2026. EIA publishes volumes in million cubic feet, and the table divides them by one million. Exports include pipeline gas and LNG.
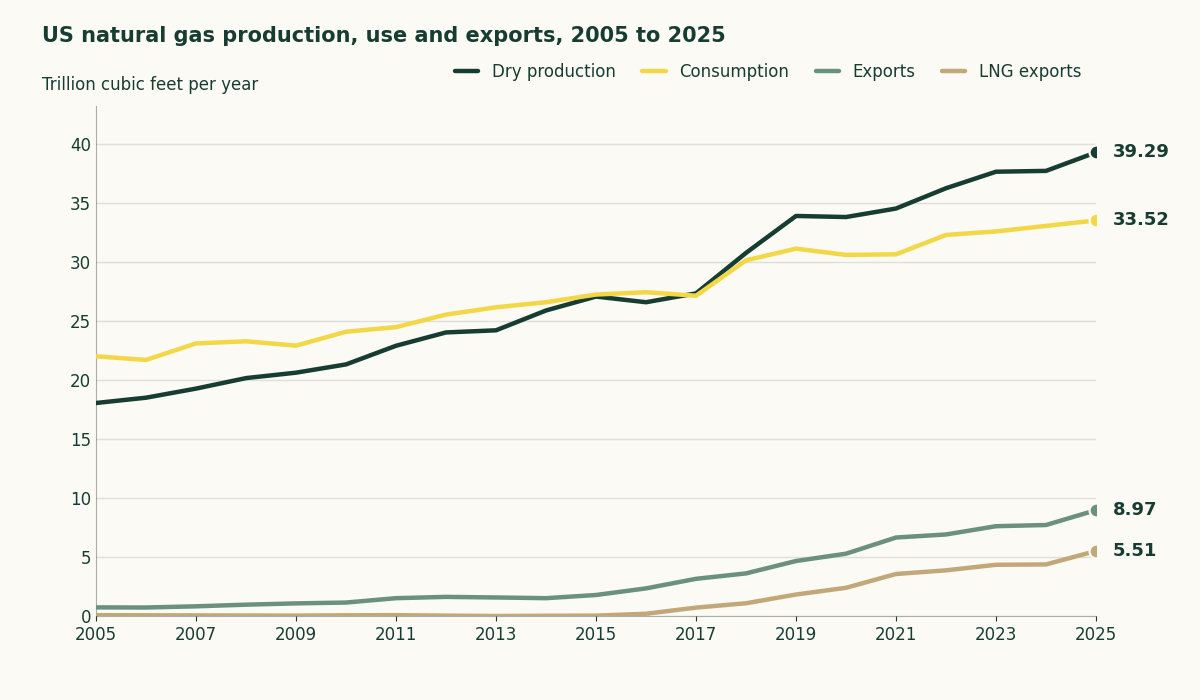
In the table, dry production passes consumption in 2017 and stays above it. LNG exports rose from 0.19 Tcf in 2016 to 5.51 Tcf in 2025.
EIA’s explainer page says the US has been a net exporter since 2016, but its annual tables show imports of 3.01 Tcf in 2016 against exports of only 2.34 Tcf in the table above, and 2017 was the first year exports came out ahead.
On EIA’s marketed-gas measure, which runs higher than dry gas, production reached a record 118.5 Bcf/d in 2025, and EIA forecasts 122.5 Bcf/d in 2026.
What is natural gas used for?
Electric power was the largest use of natural gas in 2025, at 13.05 Tcf. Industry came next.
| Sector | 2025 consumption (Tcf) | Share of US total (%) |
|---|---|---|
| Electric power | 13.05 | 38.9 |
| Industrial | 8.63 | 25.7 |
| Residential | 4.84 | 14.4 |
| Commercial | 3.61 | 10.8 |
| Lease and plant fuel | 2.04 | 6.1 |
| Pipeline and distribution use | 1.30 | 3.9 |
| Vehicle fuel | 0.05 | 0.2 |
| All uses (total) | 33.52 | 100.0 |
Source: EIA, Natural Gas Consumption by End Use, 2025. Shares are computed from the total on the same page. EIA treats the latest year’s power-sector volumes as preliminary.
In July 2026, power plants took 49.39 Bcf/d, the highest daily rate for any month in EIA’s data, which starts in 2001. In homes, gas supplied about 43% of the energy used in 2020.
Trade groups count customers differently from EIA and don’t date their figures. The American Gas Association (AGA) says more than 189 million Americans and 5.8 million businesses use natural gas, and the Natural Gas Supply Association says nearly 70 million US homes are heated with it. EIA’s 58% figure comes from a survey of homes, so it’s the one to compare against.
Vehicle fuel is the smallest line in the table. The natural gas vehicles page covers where it’s used.
How much LNG does the US export?
US LNG exports averaged 17.4 Bcf/d in the first half of 2026, 23% more than in the first half of 2025. LNG is natural gas chilled to minus 260 degrees Fahrenheit, where it becomes a liquid 600 times smaller than the gas.
Reuters reported, citing preliminary LSEG data, that the US shipped 111 million metric tons of LNG in 2025, the first country to pass 100 million. WorkBoat reported 2025 exports of 15.1 Bcf/d, a record.
In March 2026, disruptions to shipments through the Strait of Hormuz cut off 20% of global LNG supplies, mostly from Qatar, according to EIA. The IEA expects global gas demand to fall about 0.5% in 2026.
Cheniere says its Sabine Pass terminal had exported more than 3,460 LNG cargoes totaling about 240 million tonnes as of July 31, 2026. Golden Pass, the ninth US LNG terminal, shipped its first cargo on April 22, 2026, and EIA lists its full nominal capacity at 2.0 Bcf/d.
| Terminal | State | First exports | Status on Dec. 31, 2025 | Capacity (Bcf/d) |
|---|---|---|---|---|
| Sabine Pass | Louisiana | Feb 2016 | Operating | 4.55 |
| Corpus Christi | Texas | Dec 2018 | Operating | 3.31 |
| Plaquemines | Louisiana | Dec 2024 | Operating | 3.40 |
| Freeport | Texas | Sep 2019 | Operating | 2.38 |
| Cameron | Louisiana | May 2019 | Operating | 2.12 |
| Calcasieu Pass | Louisiana | Mar 2022 | Operating | 1.76 |
| Cove Point | Maryland | Mar 2018 | Operating | 0.77 |
| Elba Island | Georgia | Sep 2019 | Operating | 0.36 |
| Rio Grande | Texas | 2027 (est.) | Under construction | 3.61 |
| Golden Pass | Texas | Late 2025 (est.) | Under construction | 2.57 |
| Louisiana LNG | Louisiana | 2029 (est.) | Under construction | 2.33 |
| CP2 | Louisiana | 2027 (est.) | Under construction | 2.04 |
| Port Arthur | Texas | 2027 (est.) | Under construction | 1.91 |
| Port Arthur Phase II | Texas | 2030 (est.) | Under construction | 1.91 |
Source: US Department of Energy, Liquefied Natural Gas Exports snapshot, December 2025. Capacity is the volume DOE lists as operating or under construction on December 31, 2025. The under-construction rows leave out Corpus Christi Stage 3, which DOE counts in its 15.05 Bcf/d total, and Golden Pass has shipped since.
How much does natural gas cost?
The Henry Hub benchmark spot price averaged $3.52 per million Btu in 2025. It was $6.45 in 2022 and $2.19 in 2024. Over the same two years the residential price went from $14.75 to $14.50 per thousand cubic feet.
| Year | Henry Hub spot ($ per million Btu) | Residential ($ per Mcf) | Commercial ($ per Mcf) | Industrial ($ per Mcf) | Electric power ($ per Mcf) |
|---|---|---|---|---|---|
| 2014 | 4.37 | 10.97 | 8.90 | 5.62 | 5.19 |
| 2015 | 2.62 | 10.38 | 7.91 | 3.93 | 3.38 |
| 2016 | 2.52 | 10.05 | 7.28 | 3.51 | 2.99 |
| 2017 | 2.99 | 10.91 | 7.88 | 4.08 | 3.51 |
| 2018 | 3.15 | 10.50 | 7.79 | 4.19 | 3.68 |
| 2019 | 2.56 | 10.51 | 7.61 | 3.90 | 2.99 |
| 2020 | 2.03 | 10.78 | 7.48 | 3.32 | 2.49 |
| 2021 | 3.89 | 12.18 | 8.79 | 5.44 | 5.43 |
| 2022 | 6.45 | 14.75 | 11.32 | 7.69 | 7.51 |
| 2023 | 2.53 | 15.40 | 11.04 | 4.53 | 3.50 |
| 2024 | 2.19 | 14.50 | 10.07 | 4.07 | 2.87 |
| 2025 | 3.52 | 15.34 | 10.98 | 5.23 | 4.02 |
Source: EIA, Henry Hub Natural Gas Spot Price, Residential, Commercial, Industrial and Electric Power delivered prices, annual, in nominal dollars. Henry Hub is in dollars per million Btu and the delivered prices are in dollars per thousand cubic feet (Mcf). EIA’s annual Henry Hub series has no value for 2013, so the table starts in 2014.
The residential price was 42% higher in 2025 than in 2020 before inflation, a share computed from EIA’s price table.
In January 2026, natural gas prices averaged $7.72 per million Btu as cold weather increased heating demand, reduced production and led to record storage withdrawals during Winter Storm Fern. EIA’s February forecast for the 2026 average was $4.30, and its September forecast is $3.43 for 2026 and $3.28 for 2027.
What are the pros and cons of natural gas?
EIA calls natural gas a relatively clean-burning fossil fuel. Its coefficients put the carbon dioxide from burning gas at 52.91 kilograms per million Btu, against 95.99 for coal.
| Fuel | CO2 released when burned (kg per million Btu) |
|---|---|
| Natural gas | 52.91 |
| Propane | 62.88 |
| Finished motor gasoline | 70.66 |
| Kerosene | 73.19 |
| Diesel and home heating fuel | 74.14 |
| Coal (all types) | 95.99 |
Source: EIA, Carbon Dioxide Emissions Coefficients by Fuel. The figures count combustion only and leave out methane that leaks before the gas is burned.
Lower carbon dioxide per unit of energy is one advantage, and a record 39 trillion cubic feet of domestic production in 2025 is another. The drawbacks are the carbon dioxide that gas still releases and the price swings in the table above. Then there’s methane, and EIA says some natural gas leaks into the atmosphere from wells and storage tanks as well as pipelines and processing plants. For how gas compares with coal and oil more broadly, see the fossil fuels page.
How much methane leaks from natural gas?
Methane is a strong greenhouse gas. EPA estimates its global warming potential at 27 to 30 over 100 years, though methane emitted today lasts about a decade in the air.
EPA’s 2022 estimates put 60% of oil and gas methane in production and 19% in transmission and storage. MIT Technology Review reported that EPA estimates roughly 1% of oil and gas produced leaks as methane.
Aerial measurements point higher than the inventory. A Nature study covering six US regions found losses ranging from 0.71% to 9.77% of covered gas production, the low end in a gas-rich region and the high end in an oil-focused one. Lead author Evan Sherwin says around 1% of well sites can make up over half the total methane emissions. Nature published a correction in May 2026, and the authors say the main results are unchanged.
Worldwide, the IEA estimates that oil, gas and coal operations emit 124 million tonnes of methane a year, including 36 million from natural gas, and that more than 35 million tonnes could be avoided at no net cost. The methane leaks page covers where the gas escapes.
Where these numbers come from
We converted EIA’s volumes from million cubic feet to trillion cubic feet and rounded to two decimals, and every share in the tables is computed from the totals on the same EIA page.
The world share comes from Energy Institute data published by Our World in Data in terawatt-hours of energy, a different basis from the volumes above. EIA’s next Short-Term Energy Outlook is due October 6, 2026, and the next Natural Gas Monthly comes October 30, 2026, and the forecasts and monthly figures here will move with them.
The LNG terminals already under construction in Texas and Louisiana
DOE counted 15.05 Bcf/d of LNG export capacity under construction at the end of 2025, with Rio Grande, Golden Pass, Louisiana LNG, CP2 and two phases of Port Arthur on the list. EIA’s September forecast has US LNG exports averaging 17.4 Bcf/d in 2026 and 18.6 Bcf/d in 2027.
Further out, EIA’s Annual Energy Outlook 2026 projects exports rising from 15 Bcf/d in 2025 to more than 30 Bcf/d by 2050 in most of its cases.
If you heat with gas, the residential column in the price table above shows the average rate US households paid each year, so it’s the line to compare your own bill against.
Top photo: BogTar201213, CC BY-SA 4.0, via Wikimedia Commons, cropped.