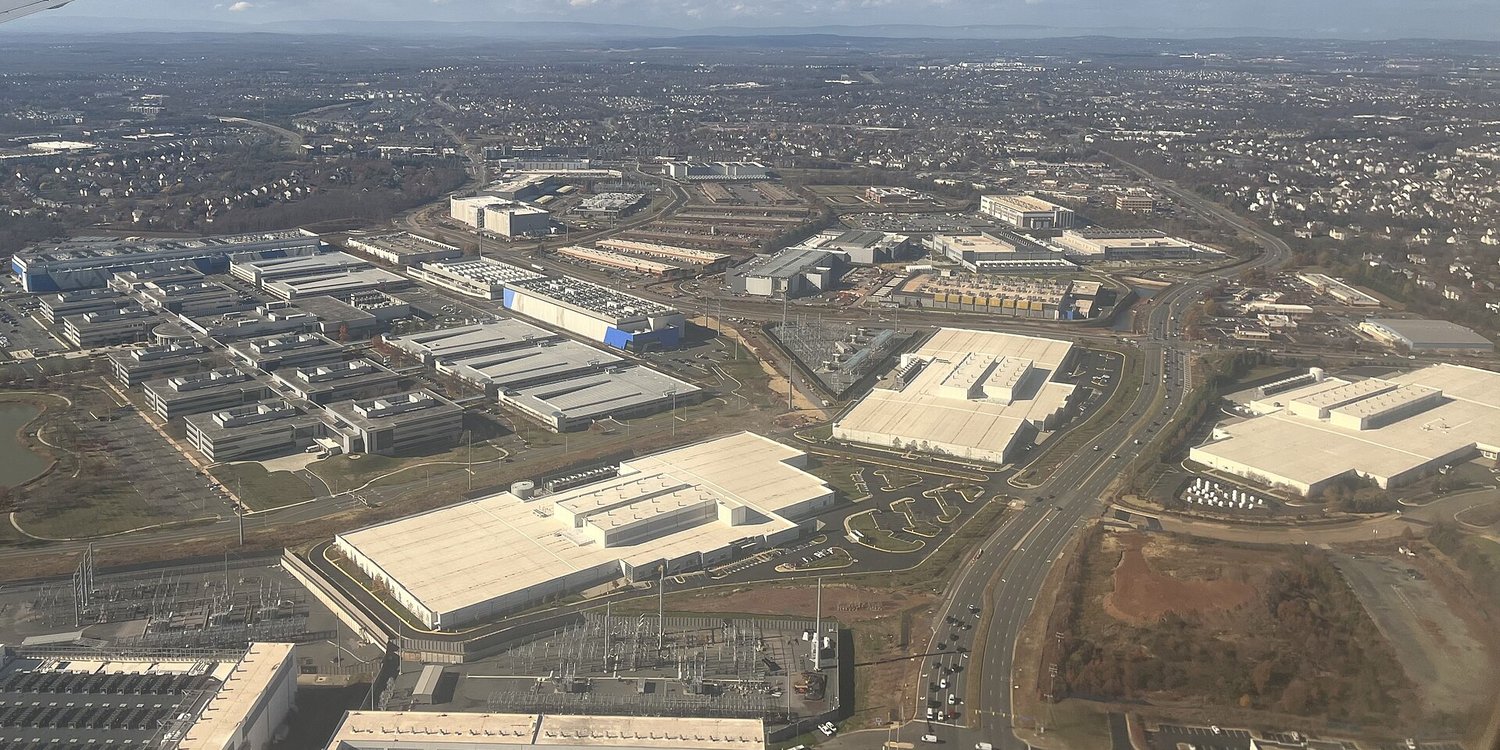
The US has about 1,400 to 2,300 operating data centers, by the count of the two trackers that publish a national total: Cleanview lists 1,418 operating data center buildings, and Kadoa, which counts physical sites, lists 2,297. US data centers used 176 terawatt-hours (TWh) in 2023, about 4.4% of US electricity. Berkeley Lab’s scenarios put the share at 6.7% to 12% by 2028. The figures come mostly from Lawrence Berkeley National Laboratory and EIA, with state detail from EPRI and the Census Bureau, and describe 2023 to 2026 unless a line says otherwise.
Top data center statistics
- Cleanview counted 1,418 operating data center buildings and 564 under construction in the US on November 4, 2026.
- Data centers used 176 TWh in 2023, up from 58 TWh in 2014, according to Lawrence Berkeley National Laboratory.
- EIA found that commercial electricity sales in Virginia rose by nearly 30 million MWh between 2019 and 2025, faster than in any state except Texas.
- Virginia has 685 data centers listed, 398 of them operating, the most of any state in Data Center Map’s February 2026 listings.
- NERC expects peak load in the Pacific Northwest to rise by 6.6 GW, or 19%, over 10 years, driven by data centers.
- ERCOT is tracking about 410 GW of large loads seeking interconnection in Texas, roughly 87% of them data centers, as of March 26, 2026.
- EIA forecasts that US commercial electricity demand, which includes data centers, will grow 2.8% in 2027.
- Pew Research Center found that 67% of planned data centers are in rural areas, while 87% of existing ones are urban.
- The Census Bureau counted 18,544 establishments in the data processing and hosting industry in 2023, a wider category than data centers.
How many data centers are in the US?
Kadoa says published estimates range from roughly 1,400 to over 4,000 US data centers, depending on whether colocation suites and enterprise server rooms count as separate facilities.
| Source | What it counts | Count | As of |
|---|---|---|---|
| Cleanview | Operating data center buildings | 1,418 | Nov 4, 2026 |
| Cleanview | Buildings in every stage, including planned and under construction | 4,537 | Nov 4, 2026 |
| Kadoa | Physical sites, without IT rooms inside office buildings | 2,297 | 2026 |
| Berkeley Lab | Data centers in its mapping dataset | 3,000+ | 2024 |
| Census Bureau | Establishments with paid employees in the data processing, hosting and related services industry | 18,544 | 2023 |
Source: Cleanview, Data centers in the United States, Kadoa, US Datacenter Tracker, Lawrence Berkeley National Laboratory, 2024 United States Data Center Energy Usage Report and Census Bureau, County Business Patterns 2023.
The Census figure comes from a federal survey, and it answers a different question. County Business Patterns counts establishments with paid employees in an industry, so it measures a line of business and not a building type. The same industry had 17,539 establishments in 2022.
If you work in it, the industry employed 629,527 people in 2023, which is a count of jobs and not of buildings.
Operating counts are the closest to like for like, because the all-stage counts include projects that aren’t built yet.
Which states have the most data centers?
Virginia leads with 685 data centers listed, 398 of them operating, in Data Center Map listings from February 19, 2026 that Pew Research Center analyzed.
| State | Data Center Map total | Data Center Map operating | Data Center Map planned | Cleanview operating (Nov 4, 2026) |
|---|---|---|---|---|
| Virginia | 685 | 398 | 287 | 359 |
| Texas | 466 | 296 | 170 | 169 |
| California | 331 | 277 | 54 | 72 |
| Illinois | 262 | 139 | 123 | 48 |
| Georgia | 235 | 94 | 141 | 48 |
| Ohio | 223 | 166 | 57 | 81 |
| Arizona | 184 | 98 | 86 | 80 |
| New York | 154 | 148 | 6 | 16 |
| Oregon | 142 | 115 | 27 | 100 |
| Washington | 135 | 124 | 11 | 42 |
Source: Pew Research Center, top states for data centers, using Data Center Map data accessed February 19, 2026. Cleanview state pages for Virginia, Texas, California, Illinois, Georgia, Ohio, Arizona, New York, Oregon and Washington.
The two trackers diverge widely in California. We couldn’t find either one explaining the gap, so the table keeps them in separate columns and the counts shouldn’t be added together.
Virginia is the one state where independent sources line up. The state’s legislative auditors found about 340 data center buildings on about 150 sites in December 2024, and Cleanview lists 359 operating buildings as of November 4, 2026.
Georgia is the other state to look at. Data Center Map lists more planned data centers there than operating ones, 141 against 94.
The Census industry count follows a different pattern. It puts California at 2,698 establishments in 2023 and Virginia at 641, even though EPRI’s table above puts Virginia first for data center electricity, which shows why that code isn’t a facility count.
How much electricity do US data centers use?
US data centers used 176 TWh in 2023, 4.4% of US electricity, in Lawrence Berkeley National Laboratory’s modeled estimate for the Department of Energy.
| Period | US data center electricity (TWh per year) | Share of US electricity (%) |
|---|---|---|
| 2014 to 2016 | about 60 | not reported |
| 2018 | 76 | 1.9 |
| 2023 | 176 | 4.4 |
| 2028, low scenario | 325 | 6.7 |
| 2028, high scenario | 580 | 12.0 |
Source: Lawrence Berkeley National Laboratory, 2024 United States Data Center Energy Usage Report. The 2028 rows are scenarios.
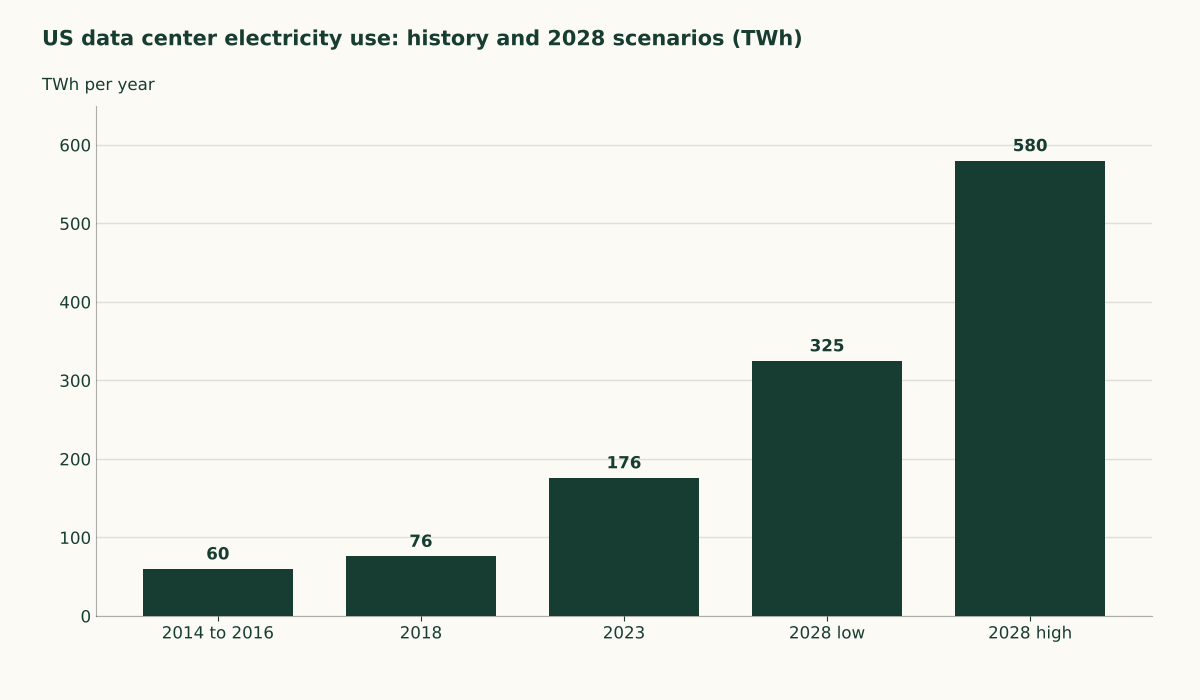
Use stayed flat for the first three years of that series. Berkeley Lab’s 2016 report had put 2014 at 70 billion kWh, 1.8% of US electricity, and the 2024 report revised the early years down to about 60 TWh, so the two reports shouldn’t be mixed in one series.
EIA measures a narrower slice. Its projections put servers alone at 7% of commercial electricity use in 2025, and that counts servers alone.
The wider story of how the grid is coping with that load is in the piece on how AI demand is straining the US grid.
How much of each state’s electricity goes to data centers?
EPRI estimated that data centers used 25.59% of Virginia’s electricity in 2023, the highest share among the 15 states it modeled.
| State | Data center use, 2023 (MWh) | Share of state electricity, 2023 (%) | Share in 2030, higher-growth scenario (%) |
|---|---|---|---|
| Virginia | 33,851,122 | 25.59 | 46.00 |
| Texas | 21,813,159 | 4.59 | 10.64 |
| California | 9,331,619 | 3.70 | 8.70 |
| Illinois | 7,450,176 | 5.48 | 12.56 |
| Oregon | 6,413,663 | 11.39 | 24.14 |
| Arizona | 6,253,268 | 7.43 | 16.58 |
| Iowa | 6,193,320 | 11.43 | 24.21 |
| Georgia | 6,175,391 | 4.26 | 9.92 |
| Washington | 5,171,612 | 5.69 | 13.00 |
| Pennsylvania | 4,590,240 | 3.16 | 7.49 |
| New York | 4,067,385 | 2.84 | 6.75 |
| New Jersey | 4,038,360 | 5.42 | 12.44 |
| Nebraska | 3,959,520 | 11.70 | 24.71 |
| North Dakota | 3,915,720 | 15.42 | 31.11 |
| Nevada | 3,416,707 | 8.69 | 19.07 |
Source: EPRI, Powering Intelligence, Table 2. The scenarios apply national growth estimates to state-level estimates of current demand.
If you live in Virginia, about a quarter of the electricity your state uses goes to data centers on EPRI’s numbers.
Virginia’s legislative auditors tried to price that growth for households. A typical Dominion Energy residential customer could see generation and transmission costs rise by $14 to $37 a month by 2040, in constant dollars. What you pay now depends on your state, and the page on what electricity costs in each state shows where yours sits.
How much more electricity will data centers use?
Berkeley Lab’s scenarios put data centers at 325 to 580 TWh in 2028.
| Forecaster | What it covers | Year | Result |
|---|---|---|---|
| Berkeley Lab | US data center electricity, scenario range | 2028 | 325 to 580 TWh |
| EPRI | US data center share of US generation, four scenarios | 2030 | 4.6% to 9.1% |
| EIA, Annual Energy Outlook 2026 | Servers in US commercial buildings only | 2050 | 446 to 818 billion kWh |
| EIA, Short-Term Energy Outlook | US commercial-sector electricity demand, growth | 2027 | 2.8% |
| PJM | Summer peak demand across its grid, all customers | 2036 | about 222,000 MW |
| ERCOT | Large loads seeking interconnection, about 87% data centers | Mar 26, 2026 | about 410 GW |
Source: Berkeley Lab report via DOE, EPRI, EIA Today in Energy, May 19, 2026, EIA Short-Term Energy Outlook, October 6, 2026, PJM Inside Lines, January 14, 2026 and ERCOT, April 2026 board update.
These forecasts measure different things, so the rows can’t be ranked against each other. The two national data center projections start from different baselines, and EPRI’s 2030 ceiling sits below Berkeley Lab’s 2028 ceiling in the table.
PJM, the grid operator for much of the East, expects a summer peak of about 222,000 MW in 2036, a rise of nearly 66,000 MW in 10 years. Its forecast assumes data centers run at 70% of their final capacity unless an owner shows otherwise. How PJM pays for that capacity is covered in the explainer on how PJM’s capacity prices are set.
ERCOT’s figure counts requests for interconnection. The same slide notes the queue grew by 178 GW since the end of 2025, and a request can be withdrawn.
EIA’s near-term view is smaller and more specific. Its October outlook has commercial demand growing 2.8% in 2027, and its May outlook said commercial use would pass residential use for the first time on record in 2027.
How much new generation can be matched to that load is a separate question, and the page on how much renewable power the grid can absorb takes it up.
Where are new data centers being built?
Pew Research Center counted more than 1,500 new data centers in development as of February 19, 2026, using Data Center Map listings that cover planned, land-banked and under-construction projects.
Cleanview’s lists show where buildings are under construction. It has 124 buildings under construction in Virginia and 118 in Texas, as of November 4, 2026.
The grid operators see the same geography. NERC’s 2025 assessment links the 6.6 GW rise in Northwest peak load to an influx of data centers into the Pacific Northwest.
How we compiled these numbers
We kept Cleanview and Kadoa counts apart from the Data Center Map counts, which come through Pew Research Center, because the trackers define a data center differently. Electricity figures come from Berkeley Lab and EPRI, with EIA for the forecasts, and we left out any number we couldn’t trace to a page that shows it.
Berkeley Lab and EPRI figures are modeled estimates, and the Census figure counts an industry. We converted nothing. Where two reports disagree about the same year, the page shows both. EIA’s next Short-Term Energy Outlook is due November 10, 2026, and we’ll update the forecast table when it lands.
What data center load means for your power bill
EIA said in May that residential customers would pay an average of 18.2 cents per kilowatt-hour in 2026, nearly 5% more than in 2025, and it said prices keep rising amid growing demand, particularly from the commercial sector, which includes data centers.
Who pays for new power plants is already a fight in some states. The story of Exelon’s push to own power plants again shows how that argument over rising bills is playing out.
Virginia’s auditors put the monthly cost to a typical Dominion customer at $14 to $37 by 2040. Your own state’s row in the EPRI table above is the quickest way to see how large the data center load is where you live.