Originally published April 21, 2013. Updated September 28, 2026.
The US shale gas boom made shale rock the source of 79% of US natural gas by 2024, and made the country the world’s top exporter of liquefied natural gas since 2023. Horizontal drilling and hydraulic fracturing did that by reaching oil and gas that used to sit stuck in rock too tight for a well to drain on its own. That new supply is why the price you pay for gas fell to a record low by 2024, then partly rebounded in 2025, and why gas now runs more of the country’s power plants than coal does.
What fracking is
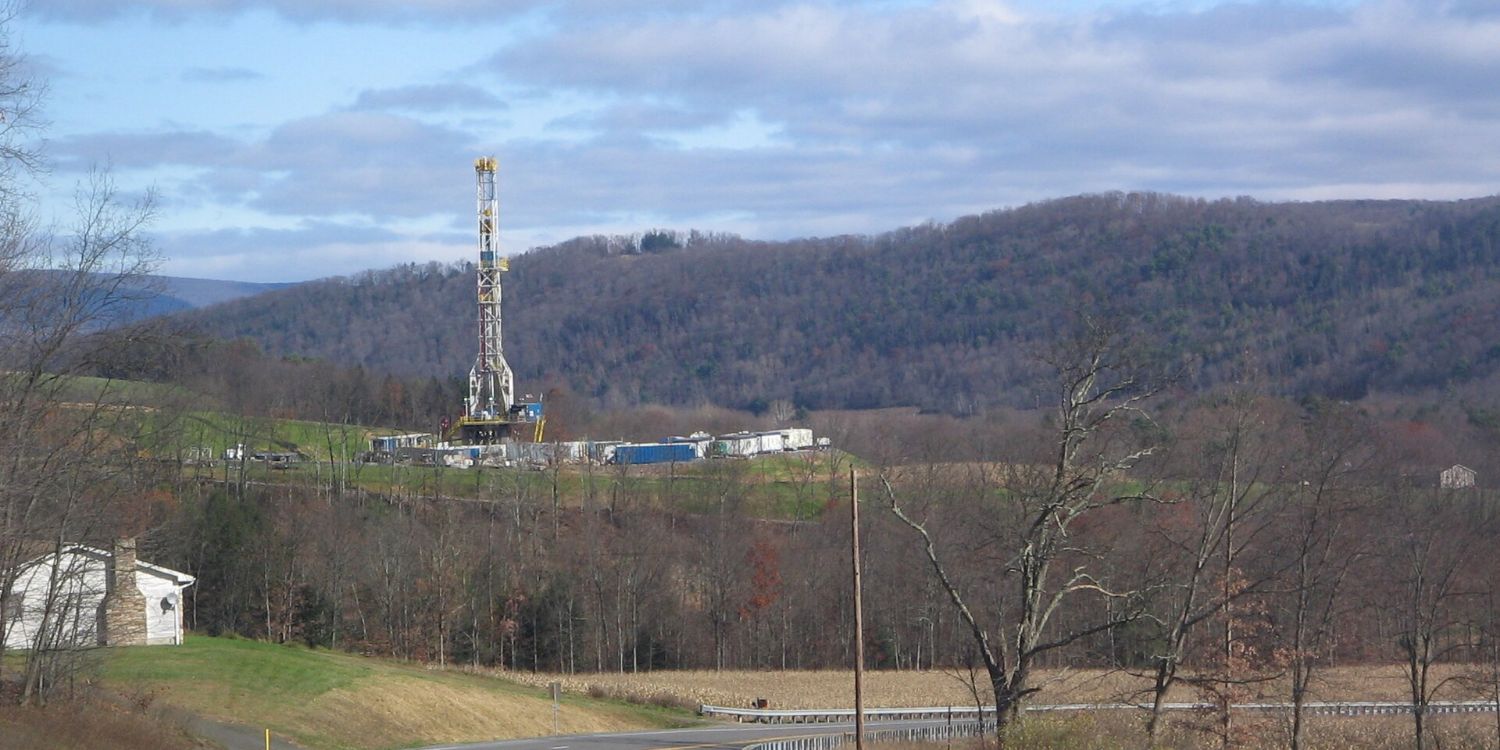
Fracking cracks open shale rock a mile or more underground by pumping in water, sand and chemicals at pressure high enough to split the rock along thousands of hairline cracks, the way a windshield spiderwebs out from a single point of impact. Horizontal drilling lets that same well bend sideways once it reaches the rock instead of stopping at the bottom of a straight hole, so one wellhead can drain gas from under a couple of miles of ground instead of the patch beneath it. Roughly 79% of the gas that reached a US stove, furnace or power plant in 2024 came up through a well drilled and fracked this way, and if you cook or heat with natural gas, that’s likely where yours started too.
Wastewater disposal from drilling can trigger earthquakes large enough to feel, which is why the US Geological Survey tracks induced seismicity across the central US separately from its water-use research. How much water each well uses, and where that water goes afterward, is covered separately in a look at fracking’s water use.
How much oil and gas the US pumps now
Shale and other tight rock formations produced 81.2 billion cubic feet of gas a day through the first three quarters of 2024, down about 1% from a year earlier, the first annual dip in shale gas output since the government started tracking it in 2000. Total US dry gas output still came in at roughly 38 trillion cubic feet for the year, about flat with 2023 and above the 36.35 trillion cubic feet the country produced in 2022, the prior record.
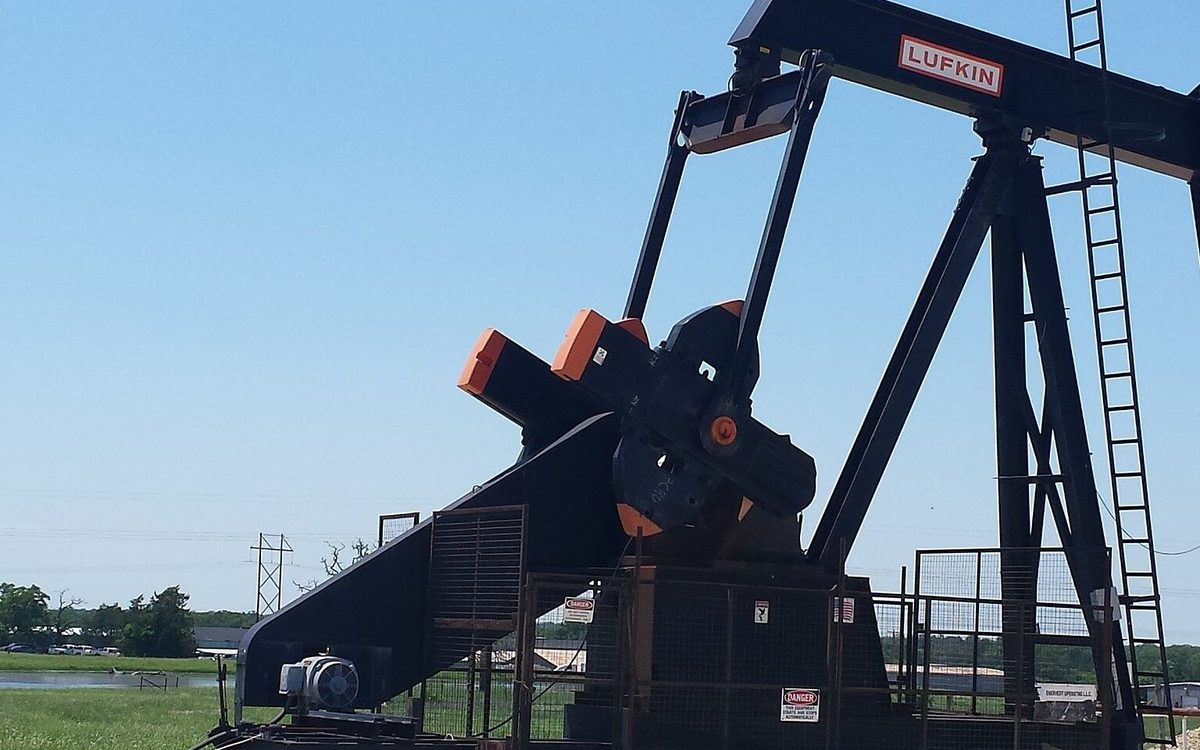
Oil output grew faster. US crude production hit 13.2 million barrels a day in 2024, 2% above the prior record. That’s more than double the 5.184 million barrels a day the country pumped in 2005, before horizontal drilling and fracking spread through US oil fields. Output kept climbing from there, reaching 13.662 million barrels a day by 2025.
None of the drilling itself is visible from your driveway. What shows up on your end is on the other side of that number, in the price of gasoline at the pump and the gas that might heat your house.
How the US became the world’s top LNG exporter
That top spot from 2023 held through the next year. The country shipped 11.9 billion cubic feet of LNG a day in 2024, about flat with the year before. Turning gas into LNG means cooling it down until it’s a liquid, dense enough to load onto tankers bound for buyers with no pipeline to the US. Pipeline gas stops at the coastline, and liquefied gas is what gets it the rest of the way.
| Exporter | LNG exports (billion cubic feet a day) | Period |
|---|---|---|
| United States | 11.9 | 2024 |
| Qatar and Australia | 10.2 to 10.7 | 2020 to 2024 range |
Source: EIA, Today in Energy, read 2026-09-25.
Qatar and Australia, its closest rivals, exported less across that entire 2020 to 2024 stretch than the US shipped in 2024 alone. Every one of those cargoes is gas that could otherwise have gone straight into the pipeline serving your furnace or stove, headed overseas instead.
What happened to natural gas prices
Henry Hub, the benchmark price for US natural gas, averaged $8.86 per million BTU in 2008, before a shale-driven glut pulled prices down. It fell to $2.75 per million BTU by 2012, and by 2024 it had reached a record low of $2.19 per million BTU, a figure EIA has also framed as close to an inflation-adjusted record. By 2025 it had climbed back, 56% higher at $3.52 per million BTU.
That round trip in Henry Hub prices is the biggest way cheap shale gas has moved your bill, whether you heat with gas directly or live somewhere that burns it for electricity. A gas bill built on the 2024 low looks a lot different than one built on the 2008 spike, even before anything else about your house changes. The 2025 rebound put a dent in that, but $3.52 is still a fraction of the $8.86 Henry Hub hit in 2008, and well below where prices sat before the 2012 glut.
How gas overtook coal in the power sector
Natural gas passed coal as the country’s top power plant fuel in 2016, when it supplied 37% of summer generation against coal’s 33%. A decade earlier, in 2006, coal still held 46% of summer generation to gas’s 25%, so the switch took about ten years.
By 2023, gas supplied 43.1% of US electricity and coal 16.2%, a much wider gap than when gas first overtook coal in 2016.
That same year, nuclear supplied 18.6% of US electricity and renewables another 21.4%. Wind made up 10.2% of that total and solar 3.9%. If a switch near you turns on a gas-fired plant instead of a coal one, that’s the 2023 split at work, when gas ran almost three times as much of the grid as coal did.
Preliminary numbers for 2025 put gas around 40% and coal near 17%. That’s a small uptick for coal, not a reversal of the 2016 crossover, and it lines up with the country’s broader decline in coal use.
The rest of that 2025 mix runs to about 24% renewables and about 18% nuclear. Wind supplied roughly 11% of it and solar roughly 6.7%. Ember’s tracking puts 2025 US gas generation at a similar 40% and finds combined wind and solar output passed coal for the first time in 2024.
Why one weak year doesn’t settle the shale gas peak question
Shale gas output fell for the first time on record in 2024, dropping about 1% to 81.2 billion cubic feet a day, even as oil production kept setting new highs of its own. A single weaker year doesn’t prove shale gas has peaked, and it doesn’t rule that out either.
Gas prices spent most of the years before 2024 far under the $8.86 per million BTU they hit in 2008. Whether the 2024 dip reflects that long stretch of cheap gas, the kind of pullback that eases once prices climb, or an early sign that the most productive shale fields are running short of easy gas, has no settled answer yet. EIA publishes updated shale gas production numbers every month, and either an extended run of higher output or another year like 2024 will show which explanation held. If it’s the second one, you’re more likely to feel it in a higher propane or gas heating bill than in a shortage at the pump.