The US produced a record 13.66 million barrels of crude oil a day in 2025, the highest annual figure in EIA’s series, which starts in 1859 and was released September 30, 2026. EIA says that’s about 40% higher on average than the next two largest producers, Russia and Saudi Arabia, and its September 2026 forecast is 13.83 million barrels a day for 2026 and 14.26 million for 2027. The figures below come mostly from EIA and describe 2025 unless a line says otherwise.
Top US oil production statistics
- EIA’s monthly series peaks at 13,995 thousand barrels a day in October 2025.
- Annual output rose 3%, or 350,000 barrels daily, in 2025 to a new record.
- Texas produced 5,761 thousand barrels daily in 2025, or 42.2% of the US total.
- New Mexico’s output went from 1,032 thousand b/d in 2020 to 2,205 in 2025.
- Offshore wells on the US Outer Continental Shelf produced a record 714 million barrels in 2025, BSEE reports.
- In 2025 the US exported 2,848 thousand barrels a day more crude oil and petroleum products than it imported, and every year since 2020 has been a net export year.
- US crude oil imports fell from 10,126 thousand b/d in 2005 to 6,168 in 2025.
- EIA’s January 2026 outlook expected 2027 output to fall 2% to 13.3 million barrels daily, a view it has since reversed.
How much oil does the US produce each year?
EIA’s annual series has US crude oil production at 13,662 thousand barrels per day in 2025, up from 5,000 in 2008.
| Year | Crude oil production (thousand b/d) |
|---|---|
| 1970 | 9,637 |
| 2000 | 5,822 |
| 2008 | 5,000 |
| 2009 | 5,357 |
| 2010 | 5,484 |
| 2011 | 5,674 |
| 2012 | 6,524 |
| 2013 | 7,495 |
| 2014 | 8,781 |
| 2015 | 9,433 |
| 2016 | 8,859 |
| 2017 | 9,374 |
| 2018 | 10,972 |
| 2019 | 12,335 |
| 2020 | 11,349 |
| 2021 | 11,324 |
| 2022 | 12,026 |
| 2023 | 12,972 |
| 2024 | 13,267 |
| 2025 | 13,662 |
Source: EIA, U.S. Field Production of Crude Oil, annual, released September 30, 2026. Crude oil includes lease condensate.
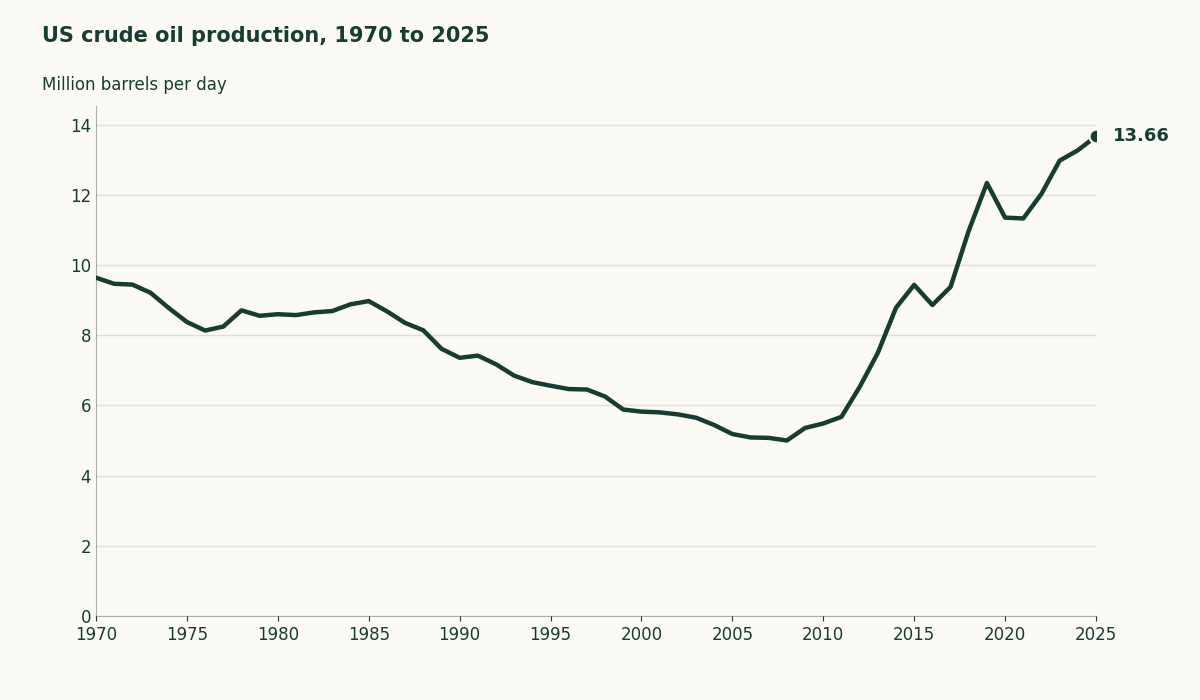
The 1970 row was the annual high for decades, and the 2018 row topped it. After 2008 the series dips at the 2016 row and again at the 2020 and 2021 rows.
What was the record year for US oil production?
EIA reported in May 2026 that the US pumped a record 13.6 million barrels of crude oil a day in 2025, above the previous record set in 2024.
EIA’s March 2026 article gave the same 13.6 million, and after its September 30, 2026 release the annual table reads 13,662 thousand barrels daily for 2025, which rounds to 13.7 million.
The record month is October 2025, at 13,995 thousand barrels daily, with April 2026 the closest since at 13,981. If you cite either one, say which you mean.
EIA revises its numbers. Rigzone reported in September 2025 that EIA’s table showed 2024 at 13.235 million barrels daily, and the table above now shows 13,267 thousand. The American Petroleum Institute’s website still calls 13.5 million barrels daily in December 2024 a record, a figure EIA’s monthly series has since passed.
What turned US oil production around after 2008?
A January 2026 preprint that hasn’t been peer reviewed credits horizontal drilling and multi-stage hydraulic fracturing with lifting US crude oil from 5 million barrels per day in 2008 to more than 12 million by 2019. The page on fracking for oil and gas covers the technique, and the page on the US shale gas boom covers the gas side of the story.
Output kept growing in 2025 while drilling slowed, and EIA reports that the average number of Lower 48 rigs was 5% below 2024 with 1% fewer wells drilled.
Oil executives answering the Dallas Fed’s survey for the third quarter of 2026 put the oil production index at 20.7, up from 15.0 in the second quarter. ExxonMobil reported record Permian production of more than 1.8 million oil-equivalent barrels a day for the second quarter of 2026, a figure that includes gas.
Which states produce the most oil?
Texas leads by a wide margin, with 5,761 thousand b/d against 2,205 for New Mexico in 2025, and the two together made 58.3% of the national figure.
| State or area | 2000 (thousand b/d) | 2010 (thousand b/d) | 2020 (thousand b/d) | 2025 (thousand b/d) |
|---|---|---|---|---|
| Texas | 1,211 | 1,169 | 4,849 | 5,761 |
| New Mexico | 184 | 180 | 1,032 | 2,205 |
| Federal offshore (Gulf of America) | 1,430 | 1,552 | 1,667 | 1,942 |
| North Dakota | 89 | 308 | 1,199 | 1,171 |
| Colorado | 50 | 91 | 469 | 475 |
| Alaska | 970 | 600 | 448 | 422 |
| Oklahoma | 191 | 192 | 472 | 404 |
| Wyoming | 166 | 148 | 243 | 289 |
| California | 741 | 549 | 395 | 288 |
| Utah | 43 | 68 | 85 | 186 |
Source: EIA, Crude Oil Production by state, annual. Federal offshore waters are not a state.
Federal offshore waters in the Gulf of America produced 1,942 thousand barrels daily in 2025, more than any state except Texas and New Mexico. North Dakota’s own count was 1,165,903 barrels daily in September 2025, within 1% of EIA’s estimate for the year, and the state says 97.5% came from the Bakken and Three Forks.
State agencies count differently from EIA. The Railroad Commission of Texas reported 4,083,173 barrels daily in December 2025 from oil leases, with condensate reported separately and the figure still preliminary, so it can’t be set against EIA’s full-year Texas estimate. EIA’s own note says its state estimates normally differ from state agency data.
If you live in Martin or Midland County, Texas, you’re in the two counties that pumped the most crude oil in December 2025, 21,192,493 barrels and 18,637,326.
How does US oil production compare with Saudi Arabia and Russia?
The US is ahead of both. EIA’s September 2026 outlook puts US crude for 2025 at 13.66 million barrels per day, against 9.33 for Saudi Arabia and 9.12 for Russia.
| Country | STEO crude oil, 2025 (million b/d) | International Energy Statistics (million b/d) |
|---|---|---|
| United States | 13.66 | 13.6 (2025) |
| Saudi Arabia | 9.33 | 9.6 (2025) |
| Russia | 9.12 | 9.9 (2024) |
| Iraq | 4.33 | n/a |
| Iran | 3.38 | n/a |
| Kuwait | 2.49 | n/a |
| Kazakhstan | 1.75 | n/a |
Source: EIA, Short-Term Energy Outlook Table 3d, September 2026 and EIA, Today in Energy, July 9, 2026, which cites EIA’s International Energy Statistics. Crude oil includes lease condensate for the US.
EIA publishes two sets of numbers for the same years. Its International Energy Statistics database has 9.6 million barrels daily for Saudi Arabia in 2025 and 9.9 million for Russia in 2024, with Russia largely unchanged in 2025. A note under the outlook table says country data can blur the line between crude oil and other liquids.
EIA also counts a wider measure of petroleum and other liquid fuels, and the outlook has US production on it at 23.69 million barrels daily in 2025. If you’ve seen a US figure near 24 million barrels daily, that’s the wider measure and it isn’t comparable with the crude numbers above.
How much oil does the US import and export?
The US imported 6,168 thousand barrels daily of crude oil in 2025 and exported 3,961.
| Year | Crude imports (thousand b/d) | Crude exports (thousand b/d) | Net imports, crude and products (thousand b/d) |
|---|---|---|---|
| 1990 | 5,894 | 109 | 7,161 |
| 2000 | 9,071 | 50 | 10,419 |
| 2005 | 10,126 | 32 | 12,549 |
| 2010 | 9,213 | 42 | 9,441 |
| 2015 | 7,363 | 465 | 4,711 |
| 2019 | 6,801 | 2,982 | 670 |
| 2020 | 5,875 | 3,206 | -635 |
| 2021 | 6,114 | 2,963 | -62 |
| 2022 | 6,281 | 3,576 | -1,191 |
| 2023 | 6,489 | 4,082 | -1,709 |
| 2024 | 6,588 | 4,093 | -2,271 |
| 2025 | 6,168 | 3,961 | -2,848 |
Source: EIA, U.S. Imports of Crude Oil, U.S. Exports of Crude Oil and U.S. Net Imports of Crude Oil and Petroleum Products, annual, released September 30, 2026. A negative net figure means the US exported more than it imported.
The 2005 row is the peak, when the US imported 12,549 thousand barrels daily more crude oil and petroleum products than it exported. The monthly numbers crossed over before the annual ones did. EIA said that in September 2019 the US became a net petroleum exporter for the first time since monthly records began in 1973.
Congress ended the crude oil export ban in a law approved December 18, 2015, which says that no official of the Federal Government shall impose or enforce any restriction on the export of crude oil. In 2015 crude exports averaged 465 thousand barrels daily, against 3,961 in 2025. A National Academy of Engineering advisor wrote in 2018 that after a 40-year ban was lifted in 2015 the US had become an exporter of oil and liquefied natural gas.
The table also shows crude imports above crude exports in every row. The energy independence page covers what net exports do and don’t mean for supply.
What does EIA forecast for 2026 and 2027?
EIA’s September 2026 outlook, completed September 3, forecasts US crude oil production of 13.83 million barrels a day in 2026 and 14.26 million in 2027.
| Region | 2025 (million b/d) | 2026 forecast (million b/d) | 2027 forecast (million b/d) |
|---|---|---|---|
| Total US crude oil | 13.66 | 13.83 | 14.26 |
| Lower 48 onshore and state waters | 11.30 | 11.38 | 11.87 |
| Federal Gulf of America (offshore) | 1.94 | 2.00 | 1.89 |
| Alaska | 0.42 | 0.45 | 0.50 |
| Permian region | 6.57 | 6.76 | 7.10 |
| Bakken region | 1.23 | 1.20 | 1.21 |
| Eagle Ford region | 1.16 | 1.15 | 1.21 |
Source: EIA, Short-Term Energy Outlook Table 4a, September 2026. The three regional rows sit inside the Lower 48 row, and regions follow geography and don’t match geologic formations. The 2026 and 2027 columns are forecasts.
EIA says the 2026 forecast would surpass the previous record of 13.7 million barrels daily set in 2025. The first half of 2026 is already in the data, at 13.7 million barrels daily, 2% more than the first half of 2025.
The forecast moved between outlooks. EIA’s October 2025 outlook had 13.5 million barrels daily for 2026, its January 2026 outlook had 2027 falling to 13.3 million, and its July 2026 outlook raised 2027 to 14.0 million. The September outlook, in the table above, is higher again.
The September outlook was written during a Middle East conflict. EIA assessed crude oil shut-ins in the region at 6.7 million b/d in August 2026 and forecast Brent at about $90 a barrel in the second half of 2026. If you filled a tank in May 2026, EIA’s July outlook put the US average retail gasoline price at $4.48 a gallon and forecast about $3.60 for the second half of 2026, before the September outlook raised the Brent forecast. The page on why oil prices swing so much covers what moves those prices.
In its May 2026 report the IEA expected five Americas producers, the US among them, to deliver close to 1.5 million barrels daily of new supply in 2026.
How we compiled these numbers
We took annual production, state estimates, imports and exports from EIA’s data pages and forecasts from EIA’s September 2026 Short-Term Energy Outlook. Crude oil means EIA’s field production of crude oil, which includes lease condensate, and it excludes the wider total of petroleum and other liquids. 2026 is a partial year, because EIA’s monthly series runs to July 2026.
We show EIA’s two sets of country figures side by side because they differ, and we left out Canada, China and Brazil because we couldn’t find one consistent crude oil source for them. The next outlook is due October 6, 2026 and the next monthly data October 30, 2026, and this page will be updated after both.
The Gulf of America projects already adding barrels
Four major Gulf of America projects have come online since January 2025, among them Shenandoah, which EIA says has produced an average of 70,000 barrels a day since July 2025. EIA expects four smaller projects by the end of 2026 and notes that hurricanes in the Gulf could disrupt the timeline.
Each table above links to the EIA page it came from, so open it, find the row for the year you need, and check the release date in the source line before you cite it, since EIA revises recent years.
Top photo: Edcdirector, CC BY-SA 4.0, via Wikimedia Commons, cropped.