Biomass is plant and animal material that people burn or turn into fuel, and it supplied about 5% of US energy in 2025. In 2020, about 11 million US households used wood for energy, mostly to heat their homes. The figures below come mostly from EIA, IRENA, Ember, the IPCC and company filings, and they describe 2025 unless a line says otherwise.
Top biomass statistics
- Biomass made up about 55% of the renewable energy the US consumed in 2025, a share computed from EIA’s Monthly Energy Review.
- US biomass use went from 5,101 trillion Btu in 2024 to 4,853 trillion Btu in 2025, a 4.9% drop computed from EIA’s preliminary table.
- Industry used 48% of the biomass energy the US consumed in 2025, more than any other sector.
- Bioenergy generated 710 TWh of electricity worldwide in 2025, about 2.2% of the total, in Ember’s data.
- IRENA counted 155 GW of bioenergy capacity worldwide in 2025, up from 104 GW in 2016.
- The UK got 14.1% of its electricity from bioenergy in 2025, the highest share among the eight countries tabled below.
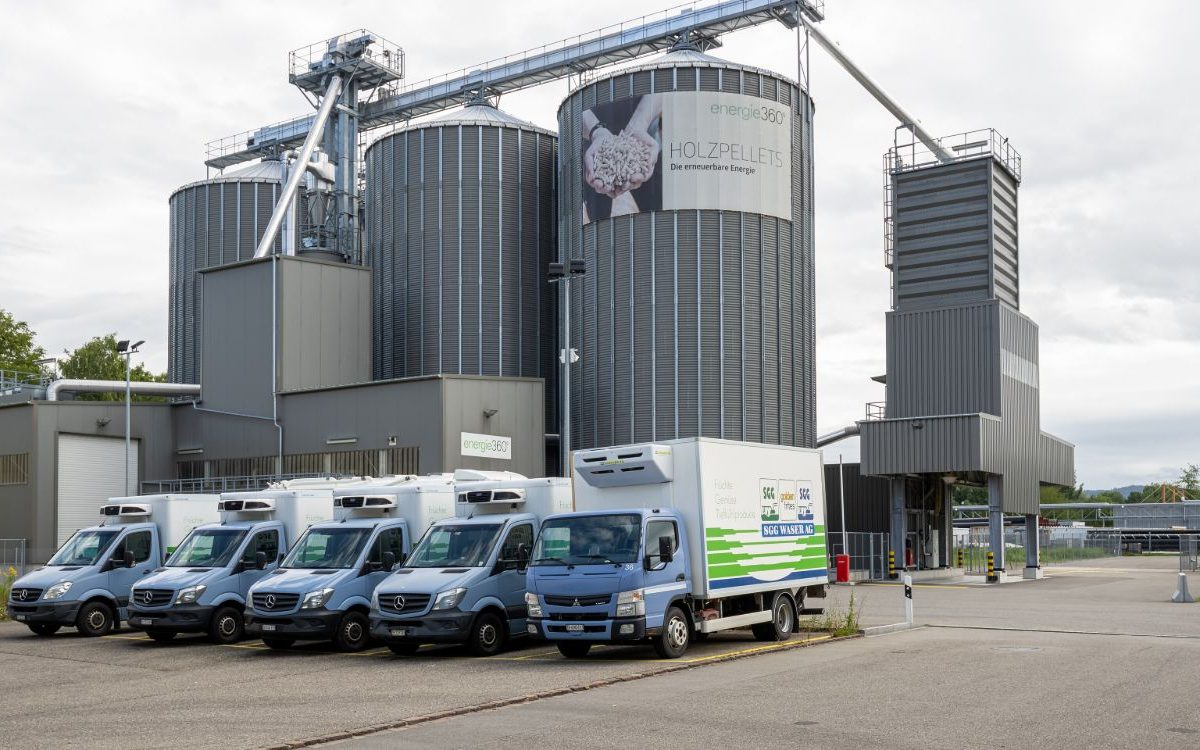
- The US had 74 operating pellet manufacturers in July 2026, with room to make 13.2 million tons a year.
- The IPCC’s 2014 lifecycle review put dedicated biomass power at a median of 230 grams of CO2-equivalent per kilowatt-hour, against 820 for coal.
- Bioenergy projects commissioned in 2025 delivered power at a global average of $86 per megawatt-hour, compared with $44 for solar PV.
What is biomass?
Biomass is organic material from plants and animals that people burn directly or convert into fuel. DOE’s list of biomass feedstocks includes dedicated energy crops, crop residues, forestry residues, algae, sawmill waste, municipal waste and wet waste.
EIA counts biomass among the major types of renewable energy, alongside hydropower, geothermal, wind and solar, the other renewable energy sources on its list. The debate over whether biomass is carbon neutral is separate, and the pros and cons section has the short version.
What are examples of biomass?
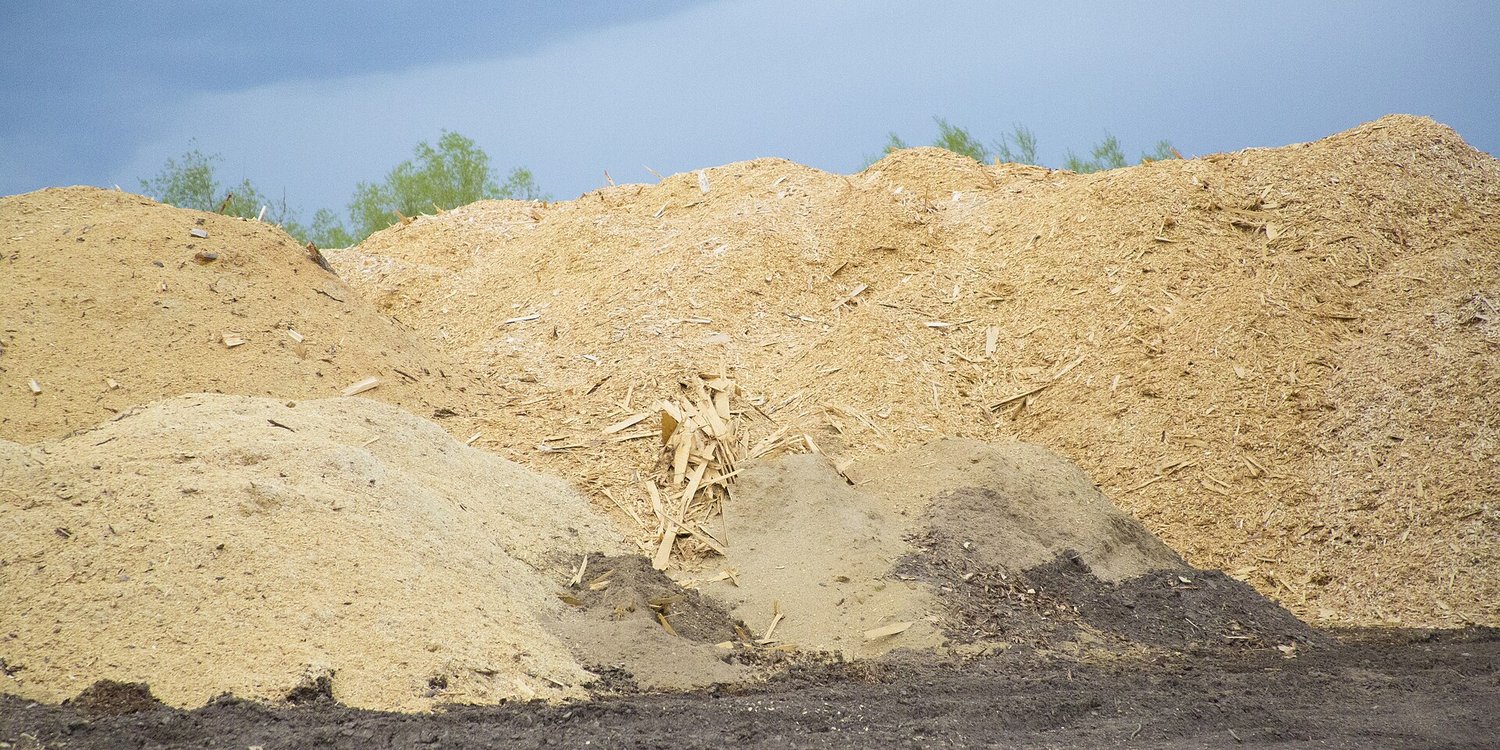
Wood and wood waste, such as bark, sawdust, wood chips, wood scrap and paper mill residues, supplied about 2% of US energy in 2025.
Crops are the liquid-fuel example. US transportation used 1,145 trillion Btu of fuel ethanol in 2025, and the guide to ethanol and other biofuels covers that side in full.
Household and industrial trash counts too. For every 100 pounds of US municipal solid waste, about 85 pounds can be burned as fuel.
Manure and sewage, along with landfill gas, make biogas, a fuel that is 45% to 65% methane depending on what it came from.
How does biomass work?
Direct combustion is the most common method of turning biomass into useful energy, and gasification heats the material with controlled amounts of oxygen or steam to make a fuel gas called syngas.
In a waste-to-energy plant, a giant claw on a crane dumps trash into a combustion chamber, and the heat turns water into steam that drives a turbine generator. A dairy farm takes a different route. Anaerobic digesters hold manure while bacteria break it down into biogas, which the farm can burn to heat water and run generators. EPA’s AgSTAR program counted 394 operating livestock digesters in 2023, up from 25 in 2000.
Landfills give off biogas too. EPA counted 542 landfill-gas energy projects running as of September 2024 and rates 444 more landfills as good candidates. It also notes that methane is at least 28 times as potent as CO2 over 100 years.
How much US energy comes from biomass?
US biomass use grew from 2,622 trillion Btu in 2001 to 4,853 trillion Btu in 2025, and biofuels supplied all of that increase. The table gives the yearly totals by type.
| Year | Wood (trillion Btu) | Biofuels (trillion Btu) | Waste (trillion Btu) | Total (trillion Btu) |
|---|---|---|---|---|
| 2001 | 2,005.8 | 252.6 | 363.9 | 2,622.4 |
| 2002 | 1,995.3 | 303.3 | 402.0 | 2,700.6 |
| 2003 | 2,002.0 | 403.1 | 401.3 | 2,806.5 |
| 2004 | 2,121.3 | 497.8 | 389.0 | 3,008.1 |
| 2005 | 2,136.7 | 574.0 | 403.2 | 3,113.9 |
| 2006 | 2,099.3 | 766.3 | 396.6 | 3,262.1 |
| 2007 | 2,088.8 | 982.8 | 413.2 | 3,484.8 |
| 2008 | 2,059.0 | 1,357.1 | 435.3 | 3,851.4 |
| 2009 | 1,935.0 | 1,553.3 | 451.7 | 3,940.0 |
| 2010 | 2,216.7 | 1,821.0 | 467.9 | 4,505.6 |
| 2011 | 2,213.2 | 1,941.5 | 461.8 | 4,616.5 |
| 2012 | 2,151.2 | 1,899.1 | 466.6 | 4,517.0 |
| 2013 | 2,338.3 | 2,026.3 | 496.4 | 4,861.0 |
| 2014 | 2,398.2 | 2,098.6 | 515.9 | 5,012.6 |
| 2015 | 2,305.4 | 2,184.7 | 518.4 | 5,008.5 |
| 2016 | 2,217.0 | 2,333.3 | 503.2 | 5,053.4 |
| 2017 | 2,175.7 | 2,364.4 | 495.3 | 5,035.3 |
| 2018 | 2,253.5 | 2,355.2 | 487.3 | 5,096.0 |
| 2019 | 2,229.2 | 2,376.2 | 442.4 | 5,047.8 |
| 2020 | 1,959.5 | 2,135.8 | 439.7 | 4,535.1 |
| 2021 | 1,991.6 | 2,330.9 | 430.3 | 4,752.8 |
| 2022 | 2,134.7 | 2,432.6 | 412.3 | 4,979.6 |
| 2023 | 1,968.0 | 2,658.8 | 394.2 | 5,020.9 |
| 2024 | 1,908.9 | 2,805.5 | 386.9 | 5,101.2 |
| 2025 (preliminary) | 1,911.8 | 2,569.5 | 371.8 | 4,853.1 |
Source: EIA, Monthly Energy Review Table 10.1, September 2026. The 2025 row is preliminary and EIA may revise it.
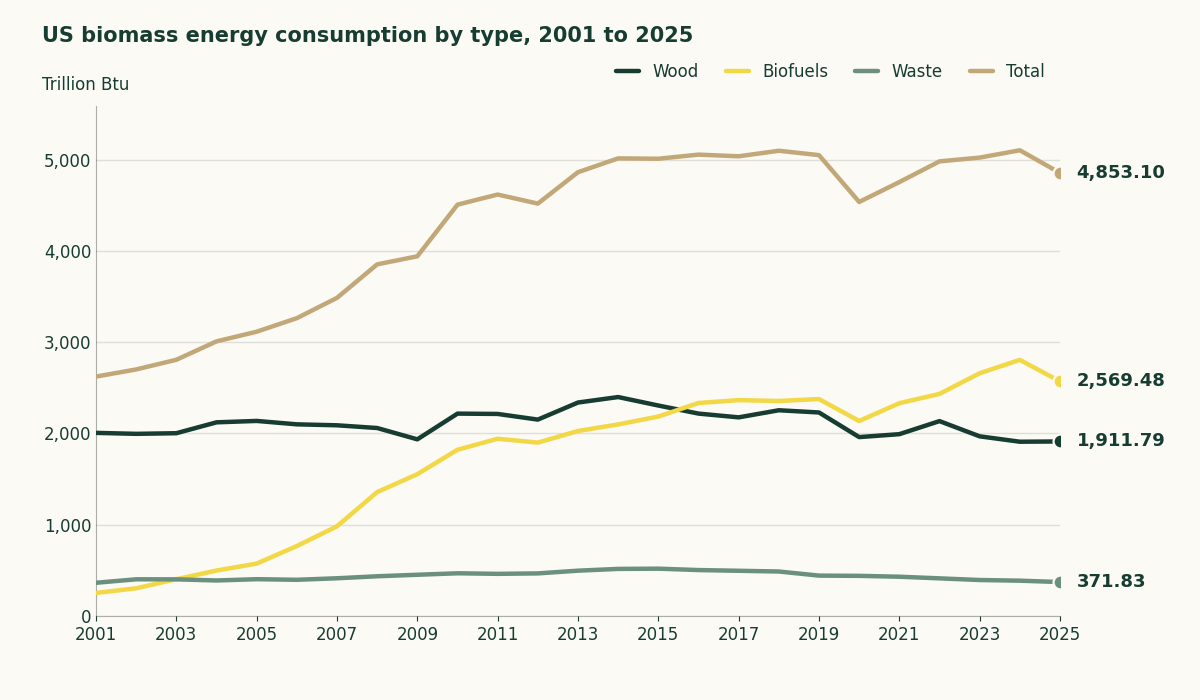
Biofuels did the growing, while wood and waste barely moved.
Who uses biomass?
Industry used the most biomass energy in 2025 at 2,317.5 trillion Btu, and the fuels that go into vehicles came next at 1,682.8 trillion Btu.
| Sector | Consumption (trillion Btu) | Share of biomass (%) |
|---|---|---|
| Industrial | 2,317.5 | 47.8 |
| Transportation | 1,682.8 | 34.7 |
| Residential (wood) | 372.0 | 7.7 |
| Electric power | 317.9 | 6.6 |
| Commercial | 162.8 | 3.4 |
Source: EIA, Monthly Energy Review Table 10.2a, Table 10.2b and Table 10.2c, September 2026, preliminary 2025 data. Shares are each sector divided by the 4,853.1 trillion Btu total, rounded to one decimal.
Wood-product makers and paper mills lead the wood side. Industry accounted for 68% of US wood energy in 2025, mostly wood-product and paper makers that burn mill waste for steam and electricity.
If you heat with firewood or pellets, you’re the residential row in that table, and the smoke findings in the pros and cons section apply to you.
Power plants take a small slice. Biomass made about 1% of US utility-scale electricity in 2025, and EIA lists biomass-fired units among generators often run as base-load resources.
How much of the world’s energy comes from biomass?
Modern bioenergy was 45% of world renewable energy supply in 2024, and traditional biomass added another 19%, according to an IEA Bioenergy presentation from June 2026.
The WHO says around 2.1 billion people still cook over open fires or on inefficient stoves that burn wood, animal dung, crop waste, coal or kerosene, and it estimates household air pollution caused 2.9 million deaths in 2021.
On the grid, China generated more bioenergy electricity than any other country in 2025, at 213 TWh.
| Country | Bioenergy electricity (TWh) | Share of electricity (%) |
|---|---|---|
| China | 213.0 | 2.0 |
| Brazil | 55.1 | 7.3 |
| Japan | 54.9 | 5.3 |
| Germany | 50.5 | 10.1 |
| United States | 46.2 | 1.0 |
| United Kingdom | 41.2 | 14.1 |
| India | 23.0 | 1.1 |
| South Korea | 19.7 | 3.2 |
Source: Our World in Data, electricity production by source and share of electricity from bioenergy, built from Ember and Energy Institute data and updated June 30, 2026. Data are for 2025.
On capacity, IRENA counts 33 GW of bioenergy in China and 10 GW in the US in 2025.
How big are biomass power plants?
Drax Power Station in North Yorkshire, England, has 2.6 GW of active dispatchable generation, several times the capacity of any other plant in the table.
| Plant | Country | Capacity (MW) | Fuel |
|---|---|---|---|
| Drax Power Station (active biomass units) | United Kingdom | 2,600 | Wood pellets |
| Lynemouth | United Kingdom | 420 | Wood pellets |
| Alholmens Kraft | Finland | 265 | Bio-fuels, at a UPM paper mill site |
| Gainesville Renewable Energy Center | United States | 102.5 | Biomass |
Source: Drax Group, 2025 full-year results, Lynemouth Power, Power Technology and EIA Today in Energy. Each figure is the operator’s or reporter’s own, the Power Technology article is undated, and the list isn’t a worldwide ranking.
Drax generated 15.0 TWh in 2025, about 6% of UK power. That is a different measure from the UK share in the country table, which covers all UK bioenergy.
The UK government said Drax’s subsidies will be halved after April 2027 and run until 2031. The deal also caps its output at 27% of capacity, and the UK regulator Ofgem fined Drax £25 million in 2024 for misreporting how it sourced its wood.
How many wood pellets does the US export?
The US exported about 9.4 million tons of wood pellets in 2025, according to EIA. In the first seven months of 2026 exports reached 5.5 million tons, a total computed from EIA’s monthly figures.
Those pellet plants employed the equivalent of 2,516 full-time workers in July 2026, according to EIA.
The UK was the main destination in 2014, when almost three-quarters of US pellet exports went there, mainly to make electricity.
What are the pros and cons of biomass?
Part of the fuel is trash. Waste-to-energy plants cut the volume of trash by about 87%, and the fuel supply is large on paper. DOE and Oak Ridge National Laboratory say the US could sustainably produce at least 1 billion dry tons of nonfood biomass a year by 2040, against about 400 million tons used when the 2023 report was written.
On cost, IRENA’s table puts bioenergy above solar and wind and below geothermal and concentrated solar.
| Source | Cost (USD per MWh) |
|---|---|
| Onshore wind | 33 |
| Solar PV | 44 |
| Hydropower | 62 |
| Offshore wind | 78 |
| Bioenergy | 86 |
| Geothermal | 89 |
| Concentrated solar | 115 |
Source: IRENA, Renewable Power Generation Costs in 2025, global weighted-average levelized cost of electricity for projects commissioned in 2025.
Carbon is the contested part. EIA says biomass is carbon neutral because source plants capture almost as much CO2 as biomass releases when burned. The IPCC’s 2014 lifecycle table gives a range that depends on the kind of biomass plant.
| Source | Median (g CO2-equivalent per kWh) | Range (g per kWh) |
|---|---|---|
| Coal | 820 | 740 to 910 |
| Gas, combined cycle | 490 | 410 to 650 |
| Biomass, co-firing | 740 | 620 to 890 |
| Biomass, dedicated | 230 | 130 to 420 |
| Solar PV, utility | 48 | 18 to 180 |
| Hydropower | 24 | 1 to 2,200 |
| Nuclear | 12 | 3.7 to 110 |
| Wind, onshore | 11 | 7 to 56 |
Source: IPCC, Fifth Assessment Report, Working Group III, Annex III, Table A.III.2, lifecycle emissions including the albedo effect, 2014.
Dedicated biomass sits well below fossil fuels such as coal and gas in that table, while co-firing biomass with coal lands close to coal itself.
Smoke is the local cost. A Science Advances study found residential wood burning accounts for 21.9% of average winter exposure to fine particles (PM2.5) across the US and leads to about 8,600 premature deaths a year, with most of those affected living in cities. Only 2% of US homes rely on wood as their main heat, so even if you never light a fire, wood smoke is part of the winter air you breathe.
Where these numbers come from
Several figures here are computed from EIA tables, namely the renewable share, the 2025 drop, the sector shares and the pellet total. EIA’s 2025 numbers are preliminary. Ember and IRENA publish different bioenergy electricity totals for the same years, so this page takes electricity from Ember through Our World in Data and capacity from IRENA.
Manure digesters under construction and cleaner wood stoves
EPA’s AgSTAR program counted 73 more livestock digesters under construction or being upgraded to make renewable natural gas, in a table that runs through 2024.
If you burn wood at home, EIA says modern wood-burning stoves, pellet stoves and fireplace inserts can reduce particulates.