The US sold about 1.5 million plug-in electric cars in 2025, slightly fewer than in 2024. By the end of that year, 5,689,100 all-electric cars and 1,765,700 plug-in hybrids were registered. The figures come mostly from Argonne National Laboratory, the Department of Energy and Kelley Blue Book, and they describe 2025 unless a line says otherwise.
Top electric car statistics
- The IEA counts around 1.5 million electric car sales in the US in 2025, slightly lower than in 2024.
- The Alliance for Automotive Innovation reports that EVs were 2.5% of all light-duty vehicles in operation in the US at the end of 2025.
- Cox Automotive estimates that battery electric cars were about 6.4% of new US vehicle sales in the third quarter of 2026, up from 5.8% in the second quarter.
- The average new EV sold for $55,879 in September 2026, according to Kelley Blue Book transaction data.
- Lithium-ion battery pack prices fell 8% to a record $108 per kWh in 2025, BloombergNEF found.
- 78,914 of the US’s public charging ports were DC fast chargers on October 15, 2026, according to the Department of Energy.
- AAA’s 2026 study found EV charging costs 66% to 70% lower than fuel costs for gas vehicles in the categories it studied.
- Pew Research Center found that 32% of US adults would seriously consider an EV as their next vehicle in March 2026, against 44% for a hybrid.
- EPA reports a record 27.2 miles per gallon for the average new vehicle in model year 2024.
What counts as an electric car
All-electric cars run on electricity only, using one or more motors powered by rechargeable battery packs. Plug-in hybrids pair a gasoline engine with a battery that charges from an outlet or charging station, and EPA reports them separately from battery-only cars. A conventional hybrid combines a gasoline engine with an electric motor, and the plug-in version adds a high-capacity battery.
In the numbers below, “plug-in” means both types, and “all-electric” or “battery electric” means a car with no gasoline engine. A plug-in hybrid can cost roughly $4 to $8 thousand more than a comparable non-plug-in hybrid, according to an undated Department of Energy estimate.
A motor turns stored electricity into motion without burning fuel. EVs convert over 77% of the electricity from the grid into power at the wheels, while gasoline vehicles convert about 12% to 30% of the fuel’s energy. EVs also emit no tailpipe pollutants, although the power plant producing the electricity may emit them. Those emissions depend on the fuel behind the grid, which makes the share of renewable energy in your state’s electricity part of the answer.
Fuel cell and natural gas vehicles are outside this page. The hydrogen fuel cells and natural gas vehicles pages cover those.
How many electric cars are on US roads
The count of registered all-electric vehicles rose 26.3% during 2025, to 5,689,100. The counts are approximate and come from the National Laboratory of the Rockies, formerly NREL, which derives them from Experian vehicle data. They’re totals through the end of each year and aren’t annual sales.
California alone holds 1,843,100 of those vehicles, about a third of the US total, and Florida and Texas follow. The Alliance for Automotive Innovation counts 164 electric models for sale in the fourth quarter of 2025.
How many electric cars does the US sell each year
Summing Argonne National Laboratory’s monthly sales table gives 1,239,505 all-electric and 270,490 plug-in hybrid sales in 2025, and the table below shows the same count back to 2017.
| Year | All-electric sales | Plug-in hybrid sales | Plug-in share of new sales (%) | Hybrid share (%) |
|---|---|---|---|---|
| 2017 | 104,487 | 91,188 | 1.1 | 2.1 |
| 2018 | 207,062 | 123,883 | 1.9 | 2.0 |
| 2019 | 233,822 | 85,791 | 1.9 | 2.4 |
| 2020 | 238,540 | 69,049 | 2.1 | 3.1 |
| 2021 | 459,474 | 176,117 | 4.3 | 5.3 |
| 2022 | 747,982 | 183,411 | 6.8 | 5.6 |
| 2023 | 1,164,638 | 293,578 | 9.4 | 7.6 |
| 2024 | 1,243,419 | 318,724 | 9.9 | 10.1 |
| 2025 | 1,239,505 | 270,490 | 9.3 | 12.8 |
Source: Argonne National Laboratory, Light Duty Electric Drive Vehicles Monthly Sales Updates, with annual sums and shares calculated from the monthly rows. Shares are of all new light-duty vehicle sales, and hybrids are conventional hybrids that don’t plug in.
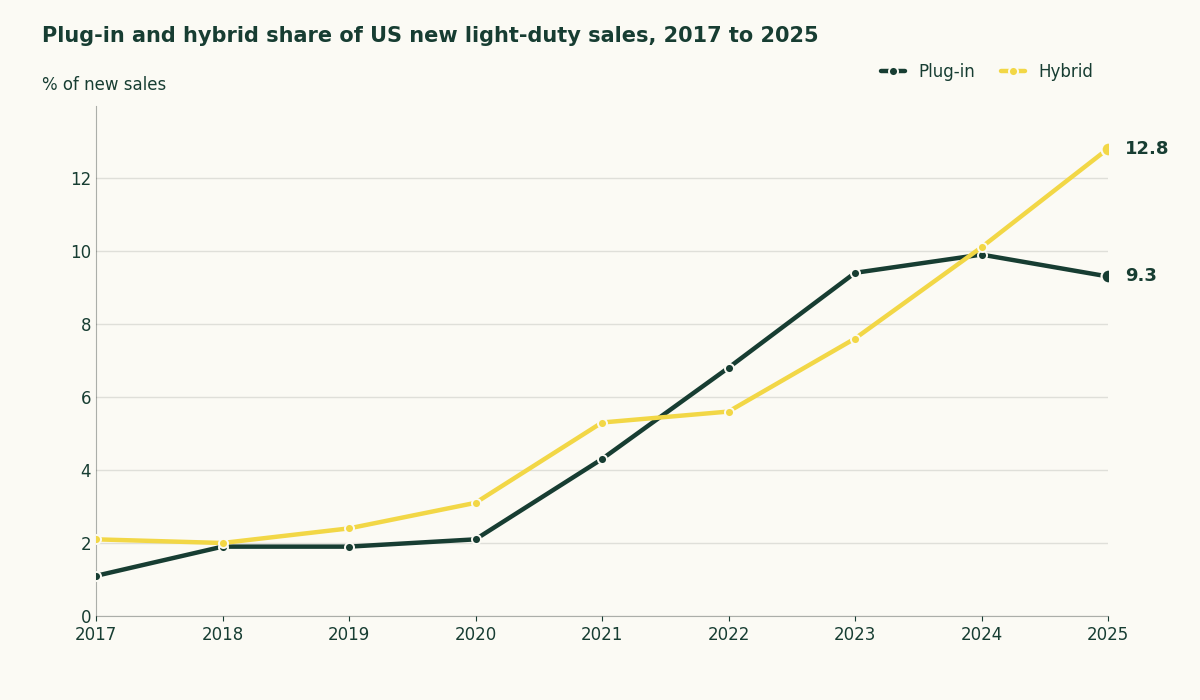
The 2024 row is where hybrids pass plug-ins, and the plug-in share dips in the row after it. Argonne’s summary page says 2025 plug-in sales fell 4% from 2024. Summing the monthly rows gives a 3.3% drop, so the decline is between 3% and 4%.
Cox’s 7.8% share for 2025 counts battery electric cars only, while the IEA’s figure of around 10% adds plug-in hybrids, as the table above does, so the two differ by definition.
Cox Automotive estimates 725,888 battery electric sales from January through September 2026, 30.3% below the same months of 2025. It puts third-quarter 2026 sales at 262,649, the highest in a year, but 39.5% below the third quarter of 2025, when buyers rushed ahead of the federal credit’s end on September 30, 2025.
Cox estimates Tesla sold 589,160 battery electric cars in 2025, 46.2% of the total. Its share of battery electric sales was 52.9% in the first nine months of 2026. How policy and other countries’ markets shape electric vehicle sales around the world has its own page.
How much electric cars cost to buy
Kelley Blue Book data put the premium for an EV at about 11% over comparable gasoline and hybrid models in 2026, down from close to 18% on average in 2025. If you shop for a new EV, the average buyer paid $55,879 in September 2026, against $50,562 for the average new vehicle of any type. Both are transaction prices, meaning what buyers paid.
Lithium-ion pack prices fell 8% in 2025 to a record $108 per kWh, and packs for battery electric vehicles averaged $99, BloombergNEF reports. BloombergNEF’s figures are global averages and say nothing directly about US sticker prices.
Charging adds a running cost on top of the purchase price, and what it costs to charge an electric car at home depends on the model’s efficiency and your local electricity rate.
Which electric cars sell the most
The Tesla Model Y led US battery electric sales in 2025 with 357,528 vehicles in Cox Automotive’s estimates, and the table below ranks ten models by their sales that year.
| Model | 2025 full-year sales | 2026 sales, January to September |
|---|---|---|
| Tesla Model Y | 357,528 | 262,491 |
| Tesla Model 3 | 192,440 | 106,962 |
| Chevrolet Equinox EV | 57,945 | 18,154 |
| Ford Mustang Mach-E | 51,620 | 17,206 |
| Hyundai Ioniq 5 | 47,039 | 31,112 |
| Honda Prologue | 39,194 | 13,289 |
| Ford F-150 Lightning | 27,307 | 4,770 |
| Rivian R1S | 24,852 | 17,259 |
| Chevrolet Blazer EV | 22,637 | 4,427 |
| Volkswagen ID.4 | 22,373 | 3,194 |
Source: Cox Automotive and Kelley Blue Book estimates, Q4 2025 EV Sales Report for 2025 and Q3 2026 EV Sales Report for January to September 2026. Models are ranked by 2025 sales.
The 2026 column covers nine months, so read it for rank order and not against the 2025 totals. Electrek’s 2025 list prints 189,903 for the Model 3, which is Cox’s 2024 figure, so the table uses Cox’s own 2025 count.
How far electric cars go on a charge
The average EPA-rated range of a new all-electric model rose from 106 miles for model year 2012 to 302 miles for 2026, in a calculation from the EPA’s certification data.
| Model year | Average range (miles) | Median range (miles) | Longest range (miles) |
|---|---|---|---|
| 2012 | 106 | 82 | 265 |
| 2013 | 106 | 84 | 265 |
| 2014 | 115 | 84 | 265 |
| 2015 | 157 | 90 | 270 |
| 2016 | 185 | 218 | 315 |
| 2017 | 187 | 205 | 335 |
| 2018 | 197 | 212 | 335 |
| 2019 | 229 | 239 | 370 |
| 2020 | 260 | 258 | 402 |
| 2021 | 247 | 239 | 405 |
| 2022 | 275 | 258 | 520 |
| 2023 | 276 | 270 | 516 |
| 2024 | 287 | 282 | 516 |
| 2025 | 292 | 289 | 512 |
| 2026 | 302 | 295 | 512 |
Source: fueleconomy.gov vehicle data file, updated September 29, 2026, with average, median and longest range calculated across every all-electric configuration listed for each model year. Every configuration counts equally and the figures aren’t weighted by sales.
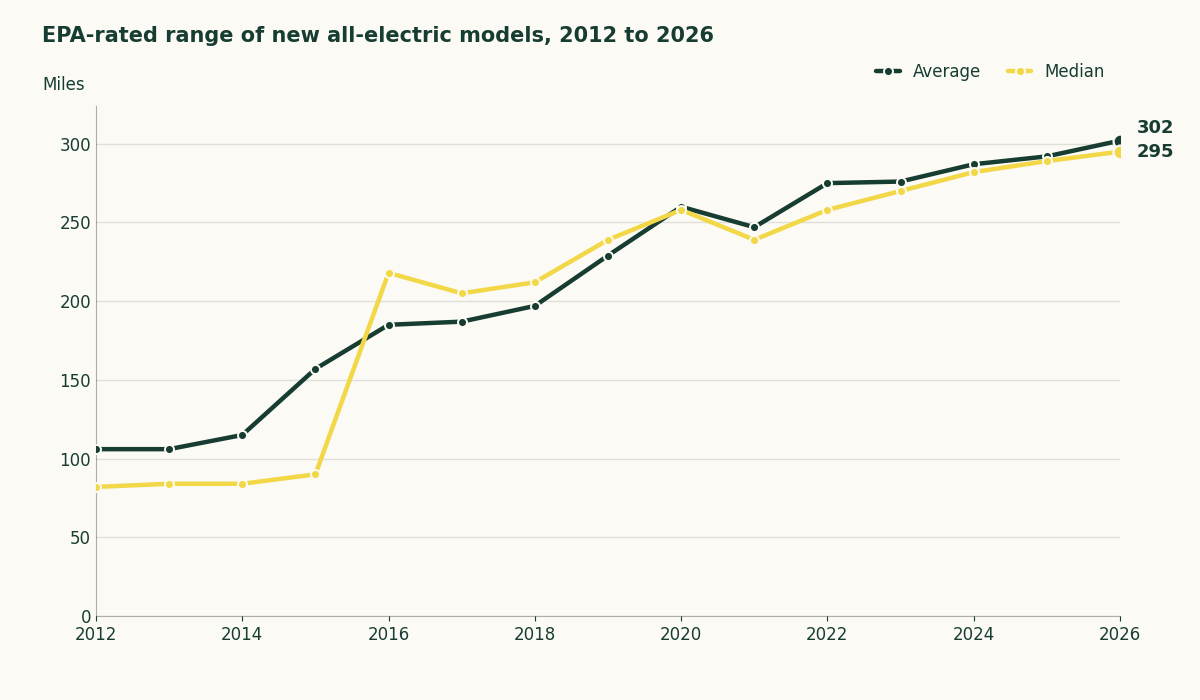
The average dipped for model year 2021 and has risen every year since. Recurrent, which analyzes real-world driving data, puts the average expected range of popular EVs at 325 miles for 2026 models, up from 293 for 2025. The two figures measure different things, since Recurrent covers popular models using real-world conditions while the EPA average counts every certified configuration.
The average 2026 EV uses 37.5 kWh per 100 miles, and the most efficient models use about 23.
How electric car charging works
The US had 82,756 public charging locations with 260,827 ports on October 15, 2026, according to the Department of Energy. Public ports come in three speeds, and Level 1 adds about 5 miles of range per hour. The table shows what the faster levels add.
| Charging level | Range added | Public ports | Share of public ports (%) |
|---|---|---|---|
| Level 1 (120 V) | About 5 miles per hour | 693 | 0.3 |
| Level 2 (240 V) | About 25 miles per hour | 181,208 | 69.5 |
| DC fast | 100 to 200+ miles per 30 minutes | 78,914 | 30.3 |
| All public ports | 260,827 | 100.0 |
Source: AFDC charging station basics for charging speeds and AFDC station counts for ports on October 15, 2026, with shares calculated from the counts.
AFDC says most EV drivers charge overnight at home with Level 1 or Level 2 equipment but gives no percentage, and that many owners can meet their daily driving needs with a Level 1 cord and an ordinary outlet. On the grid side, EPA says EV charging makes up less than 1% of California’s grid load, even during peak hours.
How long an electric car battery lasts
EPA, citing a Recurrent study, reports that battery replacements due to failure have averaged 2.5% outside major recalls and run below 0.5% for model year 2016 and later. Recurrent’s data show the average EV retains 97% of its range after three years and 95% after five.
Modeling by the National Laboratory of the Rockies suggests batteries may last 12 to 15 years in moderate climates. Extreme climates cut the modeled life to 8 to 12 years. AFDC also notes that complete data on EV battery failures isn’t available, so the lifetimes come from modeling.
Many manufacturers offer 8-year, 100,000-mile warranties on EV batteries, AFDC says. Kia covers its EV batteries for 10 years or 100,000 miles. Your own coverage depends on the maker, so check the terms for the car you’re considering.
Studies cited by AFDC find that a battery could keep at least 70% of its initial capacity at the end of its life if it hasn’t failed or been damaged. That makes second-use jobs such as stationary grid and backup power technically feasible, and it’s the work of battery energy storage systems. AFDC adds that the economics of second-life batteries are still evolving.
Costs and trade-offs of owning an electric car
AAA’s 2026 study found EV charging costs about 66% to 70% lower than fuel costs for gas vehicles in the categories it studied, though higher depreciation and finance costs often outweighed the savings. The study used national averages of $4.15 a gallon for gas and 18 cents per kWh for electricity.
AAA’s ownership-cost figures at 15,000 miles a year put the medium electric SUV at $0.955 a mile against $0.962 for gas, the only one of four classes where the electric version costs less.
| Vehicle class | Electric ($ per mile) | Gas ($ per mile) | Hybrid ($ per mile) |
|---|---|---|---|
| Medium sedan | 0.911 | 0.705 | 0.680 |
| Compact SUV | 0.793 | 0.777 | 0.747 |
| Medium SUV | 0.955 | 0.962 | 0.913 |
| Pickup truck | 1.161 | 1.108 | 1.074 |
Source: AAA, Your Driving Costs 2026, as published by Kelley Blue Book, at 15,000 miles a year. Totals count more than fuel, including depreciation and finance costs.
If you drive 15,000 miles a year in a medium sedan, those figures put the electric version about $3,090 a year above the gas one.
Smaller line items pull in opposite directions. AAA’s 2025 edition put EV maintenance at 10.07 cents a mile against 11.04 for the average vehicle. Full-coverage insurance for an EV averaged $1,995 a year against $1,694 for the average vehicle.
J.D. Power’s 2026 ownership study found that nearly all new battery EV owners, 96%, would consider another battery EV for their next vehicle. The study surveyed EV owners, so it doesn’t compare problem rates with gas cars. Shopper interest has fallen from 42% of US adults in 2022 to 32% in March 2026, the share who would seriously consider an EV.
Public charging is the gap to check before you buy
As quoted by the American Public Power Association, J.D. Power’s Brent Gruber says that public charging is the top reason new-vehicle shoppers reject EVs.
The company’s 2026 study found failed public charging visits fell to a record low of 12%, down from 14% a year earlier. Satisfaction with DC fast chargers rose 12 points to 666 out of 1,000. Satisfaction with public Level 2 chargers fell 12 points.
Before you buy, write down your daily miles and compare them with the 40 miles that 8 hours on a 120-volt outlet adds in AFDC’s example. If a home outlet covers the gap, public charging is a backup. If it doesn’t, count the DC fast ports along your usual routes before you sign anything.
Top photo: Gregory Varnum, CC BY-SA 4.0, via Wikimedia Commons, cropped.