Hydropower is electricity made by letting falling or flowing water spin a turbine, and it supplied about 14% of the world’s electricity in 2025. In the US it made about 5.5% of utility-scale electricity in 2025, roughly 1 kilowatt-hour in 18 from the country’s utility-scale plants. The figures come mostly from EIA, Ember, IRENA and the International Hydropower Association (IHA), and describe 2025 unless a line says otherwise.
Top hydropower statistics
- Hydro made 22.7% of US utility-scale renewable generation in 2025, worked out from EIA’s final figures.
- IHA counted 1,469 GW of hydropower worldwide at the end of 2025, with pumped storage above 200 GW.
- Hydro plants across the US ran at a 35.3% capacity factor in 2025, well below nuclear’s 91.0%.
- IRENA found that hydropower’s global weighted-average cost of electricity rose 9% to USD 62 per megawatt-hour in 2025.
- Paraguay made 99.47% of its electricity from hydro in 2025, and Ethiopia made 96.46%.
- Upgrades to existing plants drove most of the 2.1 GW that US conventional hydropower capacity grew between 2010 and 2022.
- Operators added 18.4 GW of renewable hydropower worldwide in 2025, and 96% of it was in China.
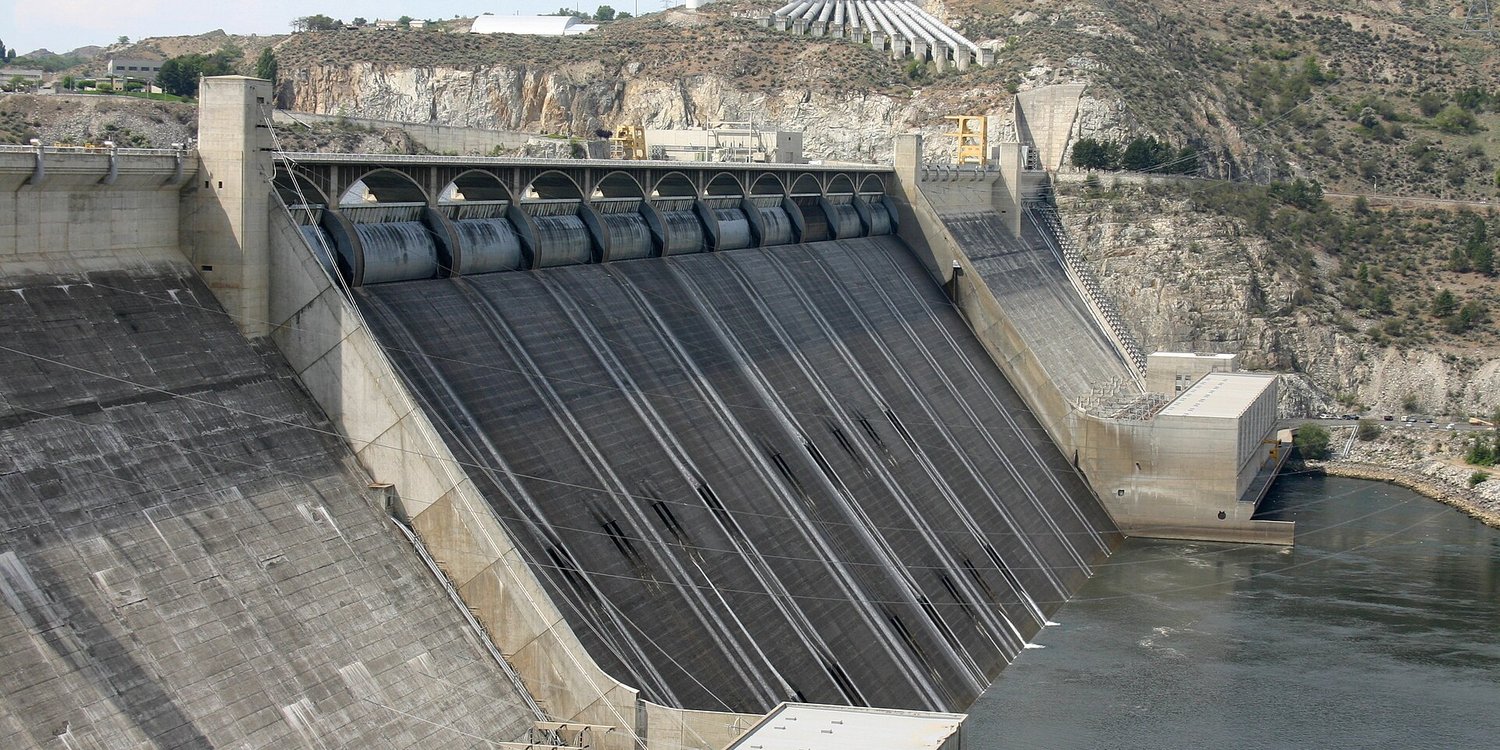
- Grand Coulee Dam in Washington has more than 6,809 MW of generating capacity, the largest hydropower complex in the US.
How does hydropower work and what types of plant are there?
A hydroelectric plant makes electricity when water runs down a pipe called a penstock and pushes against turbine blades, and the spinning turbine drives a generator.
Picture a fire hose aimed at a pinwheel. The more water flows and the higher it falls, a drop called the head, the more electricity a plant can make.
The Department of Energy sorts hydropower plants into three types, and the most common is the impoundment plant, which uses a dam to store river water in a reservoir. A diversion plant, also called run-of-river, channels part of a river through a canal or penstock and may not need a dam at all. The third type, pumped storage, uses two reservoirs at different heights and makes power as water moves down through a turbine.
DOE counts more than 90,000 dams in the US, and less than 3% of them produce power, so odds are the dam you drive past isn’t making electricity.
How much of US electricity comes from hydropower?
US conventional hydropower made 241.3 TWh of electricity in 2025, about 5.5% of utility-scale generation, in EIA’s final figures. EIA’s hydropower explainer shows 5.6% for 2025 on preliminary data, and the final figures replace it here.
| Year | Hydro (TWh) | Wind (TWh) | Solar (TWh) | Total US generation (TWh) | Hydro share of US generation (%) |
|---|---|---|---|---|---|
| 2001 | 217.0 | 6.7 | 0.5 | 3736.6 | 5.81 |
| 2002 | 264.3 | 10.4 | 0.6 | 3858.5 | 6.85 |
| 2003 | 275.8 | 11.2 | 0.5 | 3883.2 | 7.1 |
| 2004 | 268.4 | 14.1 | 0.6 | 3970.6 | 6.76 |
| 2005 | 270.3 | 17.8 | 0.6 | 4055.4 | 6.67 |
| 2006 | 289.2 | 26.6 | 0.5 | 4064.7 | 7.12 |
| 2007 | 247.5 | 34.4 | 0.6 | 4156.7 | 5.95 |
| 2008 | 254.8 | 55.4 | 0.9 | 4119.4 | 6.19 |
| 2009 | 273.4 | 73.9 | 0.9 | 3950.3 | 6.92 |
| 2010 | 260.2 | 94.7 | 1.2 | 4125.1 | 6.31 |
| 2011 | 319.4 | 120.2 | 1.8 | 4100.1 | 7.79 |
| 2012 | 276.2 | 140.8 | 4.3 | 4047.8 | 6.82 |
| 2013 | 268.6 | 167.8 | 9.0 | 4066.0 | 6.61 |
| 2014 | 259.4 | 181.7 | 17.7 | 4093.6 | 6.34 |
| 2015 | 249.1 | 190.7 | 24.9 | 4078.7 | 6.11 |
| 2016 | 267.8 | 227.0 | 36.1 | 4077.6 | 6.57 |
| 2017 | 300.3 | 254.3 | 53.3 | 4035.4 | 7.44 |
| 2018 | 292.5 | 272.7 | 63.8 | 4181.0 | 7.0 |
| 2019 | 287.9 | 295.9 | 71.9 | 4130.6 | 6.97 |
| 2020 | 285.3 | 337.9 | 89.2 | 4009.8 | 7.11 |
| 2021 | 251.6 | 378.2 | 115.3 | 4109.7 | 6.12 |
| 2022 | 254.8 | 434.3 | 143.8 | 4230.7 | 6.02 |
| 2023 | 245.0 | 421.1 | 165.5 | 4183.3 | 5.86 |
| 2024 | 242.9 | 451.9 | 219.8 | 4308.6 | 5.64 |
| 2025 | 241.3 | 461.6 | 300.3 | 4425.0 | 5.45 |
Source: EIA Monthly Energy Review, Table 7.2a for 2001 to 2024, and EIA’s final Electric Power Annual for 2025, Table 3.1.A and Table 3.1.B. Wind and solar are utility-scale, and solar includes thermal. Each hydro share is computed from the total.
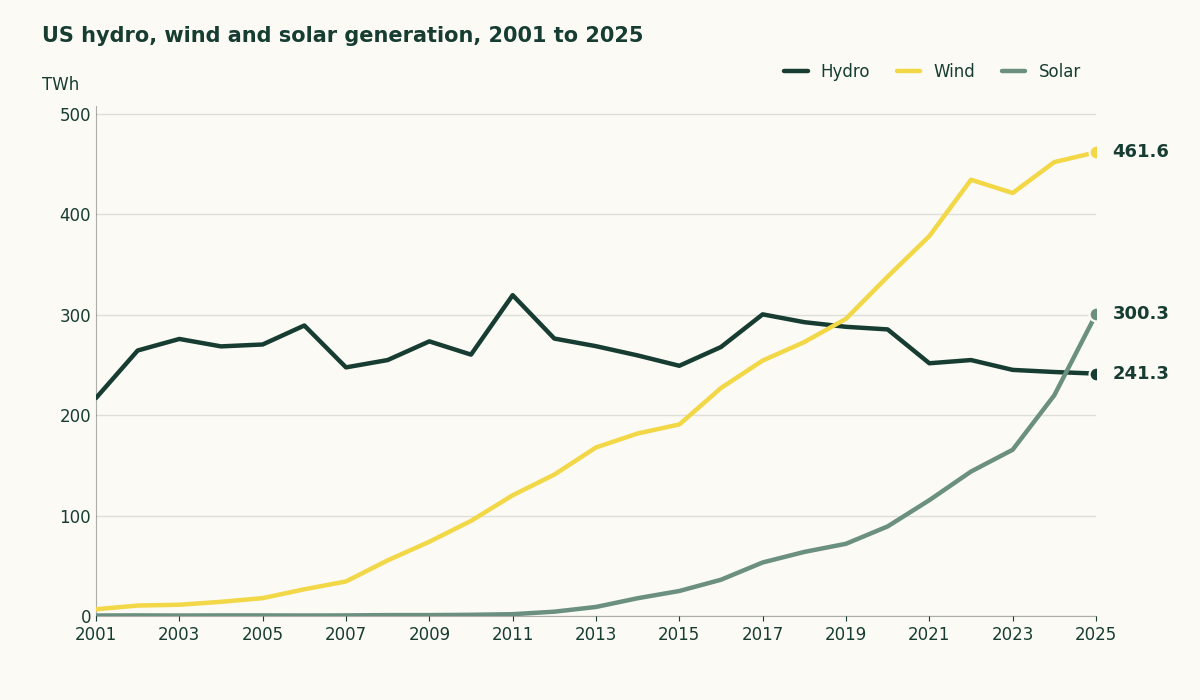
Hydro’s output in 2025 was 24.4% below its 2011 high of 319.4 TWh, the top year in the table, and the line zigzags from year to year.
Wind passed hydro in 2019, and solar’s 300.3 TWh in 2025 topped hydro’s 241.3 TWh. That puts hydro behind both wind and solar among the renewable sources that feed the US grid.
How much of the world’s electricity comes from hydropower?
World hydropower made 4,432.3 TWh in 2025, or 13.97% of global electricity, by Ember’s count. Our World in Data, which republishes Ember’s figures, shows hydro’s share of world electricity sliding from 16.3% in 2020 to 14.0% in 2025.
Ember’s review found output similar to 2024, with China up 45 TWh and India up 21 TWh after strong monsoon rainfall. Output fell 25 TWh in Brazil and 43 TWh in the EU, where Ember says alpine regions were hit by lower precipitation after good hydro conditions in 2024.
Three organizations publish world hydropower totals for 2025, and their numbers don’t match.
| Measure | Ember | IRENA | IHA |
|---|---|---|---|
| Hydro generation 2025 (TWh) | 4432.3 | n/a | 4495 |
| Hydro share of world electricity 2025 (%) | 13.97 | n/a | n/a |
| Capacity excluding pumped storage 2025 (GW) | 1295.66 | 1296 | 1269 |
| Pumped storage capacity 2025 (GW) | n/a | 160 | 201 |
| Total hydropower capacity 2025 (GW) | n/a | 1456 | 1469 |
Source: Ember, Yearly electricity data, IRENA, renewable capacity report for 2026 and IHA, 2026 World Hydropower Outlook. IRENA’s capacity row excludes pure pumped storage, and IHA’s counts conventional hydropower. The n/a cells mark figures a source didn’t publish in the data used.
IHA’s generation figure runs a bit above Ember’s, and neither report explains the gap.
Which countries and US states rely on hydropower most?
China makes more hydropower than any other country, and its row in the table is larger than the next five combined.
| Country | Hydro generation 2025 (TWh) | Hydro share of electricity 2025 (%) | Hydro capacity 2025 (GW) |
|---|---|---|---|
| China | 1394.79 | 13.19 | 382.08 |
| Brazil | 388.63 | 51.78 | 110.27 |
| Canada | 344.74 | 52.84 | 84.13 |
| United States | 241.7 | 5.35 | 84.15 |
| Russia | 199.73 | 16.74 | 51.83 |
| India | 177.97 | 8.55 | 49.12 |
| Norway | 144.78 | 90.01 | 34.65 |
| Viet Nam | 102.35 | 33.02 | 24.68 |
| Japan | 73.9 | 7.17 | 28.3 |
| Sweden | 68.24 | 40.08 | 16.31 |
Source: Ember, Yearly electricity data, 2025.
Hydro is a modest slice of China’s power mix even at that size. Norway, in the table, makes most of its electricity from hydro, and Paraguay and Ethiopia, which make less hydropower than any country in the table, make nearly all of theirs.
Inside the US, Washington held 27% of conventional hydropower capacity in 2025 and California held 13%, by EIA’s preliminary figures. The western states made 60% of US hydropower in the water year ending September 2023, and Washington and Oregon alone hold 37% of capacity.
If you live in a western state, you’re in the region that made most of the country’s hydroelectricity that year. Wherever you live, your state’s average cost of electricity shows what a kilowatt-hour costs in your state.
What are the biggest hydroelectric dams?
Three Gorges in China has 34 generating units and a capacity of 22.5 GW, and Baihetan, at 16 GW, was ranked the world’s second largest hydro project when it reached full operation in December 2022.
| Plant | Country | Installed capacity (MW) |
|---|---|---|
| Three Gorges | China | 22500 |
| Baihetan | China | 16000 |
| Itaipu | Brazil and Paraguay | 14000 |
| Grand Coulee | United States | 6809 |
Source: Xinhua via China’s State Council (Three Gorges), Renewable Energy World (Baihetan), Itaipu Binacional (Itaipu) and the US Bureau of Reclamation (Grand Coulee). Three Gorges is converted from 22.5 million kilowatts.
Three Gorges made 111.795 billion kWh in 2020, a record for a single power station that passed the 103.098 billion kWh Itaipu made in 2016.
Itaipu’s own site lists its best year as 103.1 million MWh in 2016. In 2025 it made 72.9 million MWh, according to Paraguay’s La Nacion, which is 29% below that best year.
How much does drought cut hydropower output?
Western US hydropower fell 11% to 141.6 million MWh in the water year ending September 2023, and EIA says drought contributed to the historically low output.
In May 2023, a heat wave 30°F above normal rapidly melted the snowpack in the Columbia River Basin region. According to EIA, water flows in May were high, but much of the water that summer generation needed melted during the heat wave.
A plant’s capacity factor is the share of its maximum possible output that it delivers over a year, and hydro’s fell to 35.0% in 2023 from 43.0% in 2017.
| Source | Capacity factor 2025 (%) |
|---|---|
| Nuclear | 91.0 |
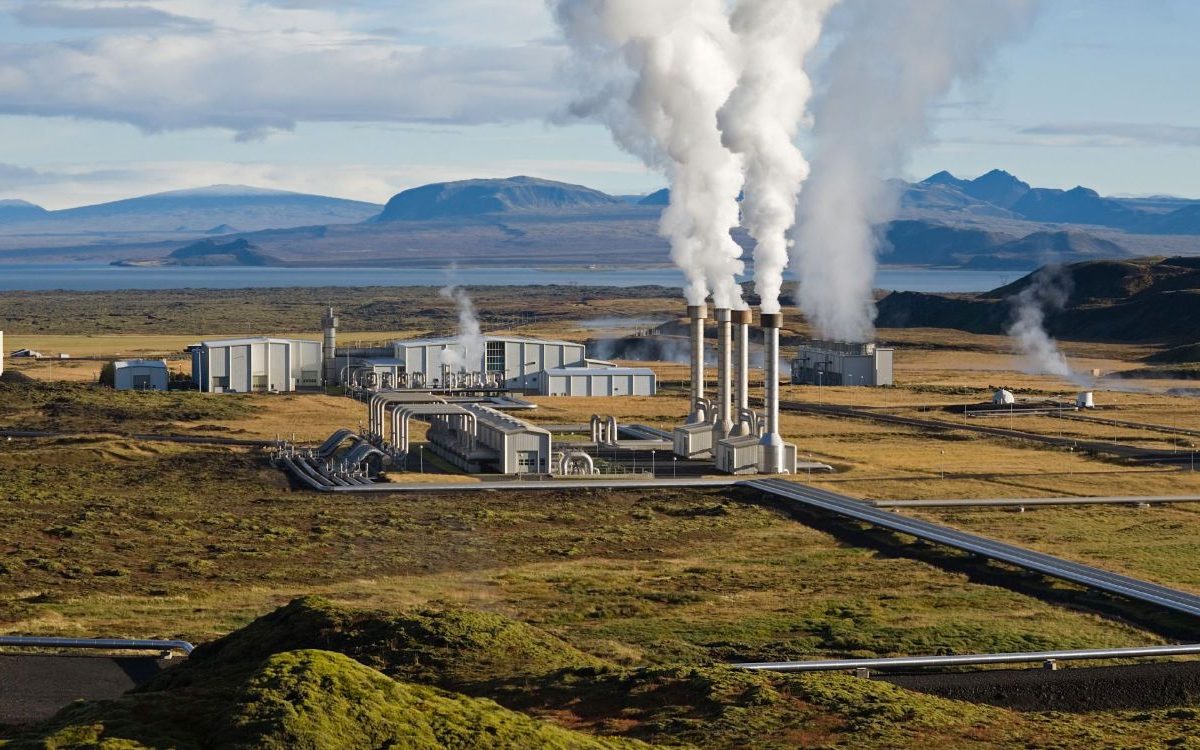
| Geothermal | 65.9 |
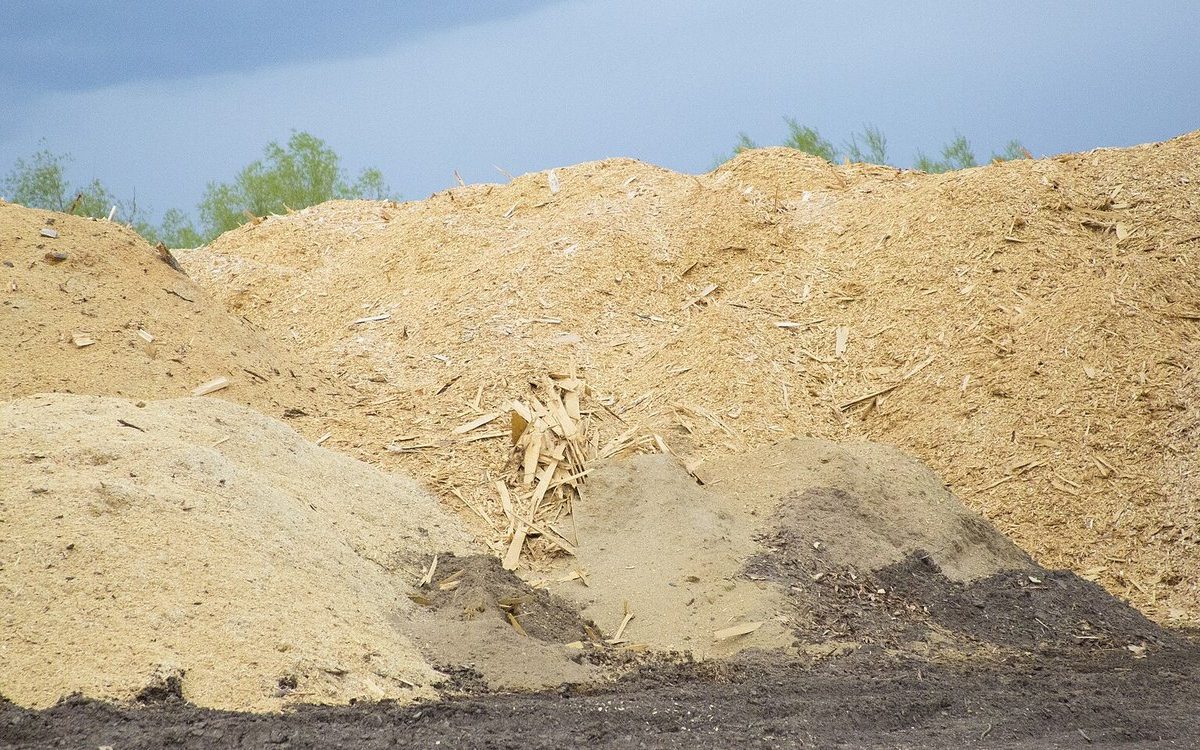
| Wood | 56.8 |
| Hydro | 35.3 |
| Wind | 34.2 |
| Solar PV | 24.4 |
Source: EIA, Electric Power Monthly Table 6.07.B, 2025 annual capacity factors for US utility-scale plants.
How does pumped storage compare with grid batteries?
At the end of 2025, US utility-scale batteries had 43.6 GW of operating power capacity, against 23,156 MW for pumped storage, or 23.2 GW.
Those are gigawatts of power, not gigawatt-hours of stored energy. EIA’s 2022 storage table lists pumped storage’s energy capacity as NA.
DOE says pumped storage acts like a giant battery. Water drops from an upper reservoir through a turbine to make power, and pumps send it back up to recharge. IHA calls pumped storage the world’s dominant form of large-scale energy storage, though POWER’s report doesn’t say whether that counts power or energy.
| Measure | Power capacity (GW) |
|---|---|
| US utility-scale batteries (EIA) | 43.6 |
| US pumped storage (EIA) | 23.156 |
| World pumped storage (IHA) | 201 |
| World pure pumped storage (IRENA) | 160 |
Source: EIA (US batteries), EIA (US pumped storage), IRENA (pure pumped storage) and IHA (all pumped storage), each at the end of 2025.
In 2019, US pumped storage returned 79% of the electricity put in, against 82% for utility-scale batteries. EIA reported in October 2019 that nearly half of the country’s pumped storage capacity still operating was built in the 1970s.
Operators added another 8.3 GW of batteries in the first half of 2026, the kind of grid-scale battery storage that competes with pumped storage on power.
How much does hydropower cost?
The average installed cost of hydropower fell 10% to USD 2,079 per kilowatt in 2025, IRENA found, yet the cost per megawatt-hour rose 9% as less favourable hydrology and higher financing costs offset the cheaper builds.
Onshore wind averaged USD 33 per megawatt-hour and solar PV USD 44 in 2025, against USD 62 for hydropower. Those figures are what it costs to make power, and what you pay at home depends on your state’s rates.
What are the pros and cons of hydropower?
Hydropower generators don’t directly emit air pollutants, EIA says. IHA cites an IPCC median of 24 grams of CO2-equivalent per kilowatt-hour over a plant’s life cycle.
Reservoirs emit methane. A 2016 global synthesis put emissions from reservoir water surfaces at 0.8 petagrams of CO2 equivalent a year, mostly methane, and it counts every reservoir, including ones used for flood control and irrigation. The exact amount of greenhouse gas reservoirs emit is uncertain and varies by site, according to EIA.
Fish pay a price too. Energy Department-sponsored turbine designs could cut fish deaths to below 2%, against 5% to 10% for the best existing turbines, EIA says.
American Rivers counted 100 dam removals in 30 states in 2025, and 2,350 documented removals since 1912, though the release doesn’t say how many of those dams made power. The largest dam removal in US history took out four hydroelectric dams on the Klamath River in 2024, and salmon returned to spawn above the old dam sites in less than a month.
Where these numbers come from
The US table joins two EIA releases. The Monthly Energy Review covers 2001 to 2024, and the final Electric Power Annual covers 2025. We worked out each hydro share, the change against 2011 and the renewable share from EIA’s totals, and comparisons like China against the next five countries come from adding the rows in the table. The world and storage tables keep each source’s own figures even where they differ, and the unit conversions (kilowatts to gigawatts, gigawatt-hours to million megawatt-hours) are plain moves of the decimal point.
The 243 GW of pumped storage already under construction
In June 2026, POWER reported that IHA counts 243 GW of pumped storage under construction worldwide, on top of more than 200 GW already operating. China began building the Yarlung Zangbo River hydropower project in 2025, and IHA’s outlook estimates it could make about 300 TWh a year, roughly three times Three Gorges.
In the US, DOE counts 43 pumped storage plants and says the country could more than double that capacity.
If you live near a dam with no generators, adding turbines to dams like it makes up 95% of the new hydropower capacity proposed in the US, by DOE’s 2023 market report.
Top photo: David Brodbeck from Seattle, WA, USA, CC BY 2.0, via Wikimedia Commons, cropped.