Fracking is short for hydraulic fracturing, a technique that injects water, sand and small volumes of chemical additives into low-permeability rock to free oil or gas, and the tight formations that need it gave the US about 64% of its crude oil in 2023. EIA says those formations need fracking and horizontal drilling to produce economically.
The figures below come mostly from EIA and other federal and state agencies, and they describe 2024 or 2025 unless a line says otherwise.
Top fracking statistics
- Tight-oil resources produced 9.35 million barrels a day of US crude in 2025, EIA estimates.
- US crude oil production set a record 13.6 million barrels a day in 2025.
- The Permian Basin’s shale and tight formations made 6.0 million barrels a day of crude oil in December 2025, which was 44% of the US total.
- Gas made up 40% of Bakken, Eagle Ford and Permian output in 2024 when measured in barrels of oil equivalent, up from 29% in 2014.
- EPA estimated that 25,000 to 30,000 new wells were drilled and fractured in the US each year from 2011 to 2014.
- Pennsylvania operators spud 444 new wells in 2025, up from 309 in 2024.
- Baker Hughes counted 599 US rigs in the week published on September 25, 2026, and 541 of them were horizontal.
- US natural gas production was 104 billion cubic feet a day in 2023, 75% above Russia’s.
- A study of 2015 data put US oil and gas methane emissions at 13 million metric tons a year, 60% above EPA’s estimate.
- Texas has required operators to post fracking chemicals on FracFocus since February 1, 2012.
What is fracking?
Fracking is a completion technique, meaning it happens after the well has been drilled. Pumps force fluid down the well until the rock cracks, and the sand in the fluid wedges open the expanding fractures.
Fracking and horizontal drilling are separate steps that work together. Hydraulically fractured horizontal wells were 69% of all US oil and gas wells drilled in 2016.
Commercial shale gas began in the Barnett Shale in Texas, where Mitchell Energy had developed a fracturing technique that produced commercial volumes of shale gas by 2000.
How does fracking work?
A fracked well reaches formations hundreds or thousands of feet below the surface. Modern shale wells then run sideways through the rock, and in the Permian Basin the horizontal section averaged more than 10,000 feet in the first nine months of 2022, against under 4,000 feet in 2010.
Longer sections came with more wells. Operators in the Permian brought on 4,524 new horizontal wells in 2021, up from 350 in 2010.
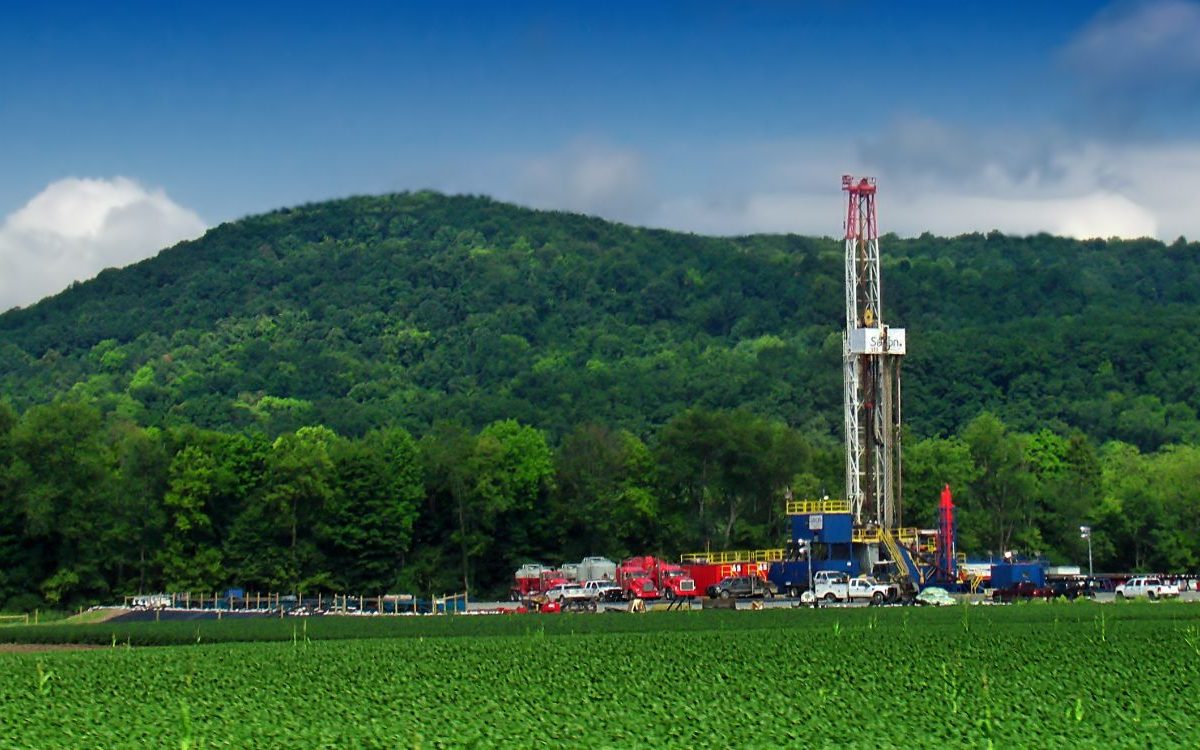
On the well pad, water, proppant and additives are blended together and pumped to a manifold, where high pressure pumps transfer the fluid to the frac head. Water tanks hold the supply, and flowback tanks hold the liquid that returns to the surface afterward.
Liberty Energy, a frac service company, says its SLXRRY sand delivery system enables reduced truck traffic and road wear, plus less dust and fewer emissions. The company’s release gives no measurements.
A typical fracking job is 85.02% water and 14.20% proppant, according to FracFocus. The remaining 0.78% is ten additive types, from a gellant at 0.5% down to a biocide at 0.001%.
| Component | Share of a typical fracturing fluid (percent) |
|---|---|
| Water | 85.02 |
| Proppant | 14.20 |
| Gellant | 0.5 |
| Acid | 0.07 |
| Corrosion inhibitor | 0.05 |
| Friction reducer | 0.05 |
| Clay control | 0.034 |
| Crosslinker | 0.032 |
| Scale inhibitor | 0.023 |
| Breaker | 0.02 |
| Iron control | 0.004 |
| Biocide | 0.001 |
Source: FracFocus, What Is Fracturing Fluid Made Of?. FracFocus calls this a generalized breakdown of a typical job and says there is no standard formula.
How much US oil comes from fracking?
Tight-oil resources produced about 64% of US crude oil in 2023, according to EIA. In 2025 the share was 68.4% when computed, from EIA’s estimate of tight oil and its count of US field production.
| Year | What EIA counted | Oil from those wells (million barrels per day) | Share of US crude oil production (percent) |
|---|---|---|---|
| 2000 | Hydraulically fractured wells | 0.102 | less than 2 |
| 2015 | Hydraulically fractured wells | more than 4.3 | about 50 |
| 2023 | Tight-oil resources | 8.32 | about 64 |
| 2025 | Tight oil (Outlook Table 10b) | 9.35 | 68.4 (computed) |
Source: EIA, Today in Energy, March 15, 2016, EIA FAQ on tight oil, EIA Short-Term Energy Outlook Table 10b, September 2026 and EIA field production of crude oil. The 2025 share is 9.35 divided by 13.662.
The rows don’t form one trend line. In 2015 EIA counted about 300,000 fractured wells that made more than 4.3 million barrels a day, about half of US crude. That count sorts oil by whether the well was fractured, while the 2023 and 2025 rows sort it by the rock it came from.
The next table gives total US crude output for scale. It covers every kind of US oil well, fracked or not.
| Year | US field production of crude oil (thousand barrels per day) |
|---|---|
| 2008 | 5,000 |
| 2009 | 5,357 |
| 2010 | 5,484 |
| 2011 | 5,674 |
| 2012 | 6,524 |
| 2013 | 7,495 |
| 2014 | 8,781 |
| 2015 | 9,433 |
| 2016 | 8,859 |
| 2017 | 9,374 |
| 2018 | 10,972 |
| 2019 | 12,335 |
| 2020 | 11,349 |
| 2021 | 11,324 |
| 2022 | 12,026 |
| 2023 | 12,972 |
| 2024 | 13,267 |
| 2025 | 13,662 |
Source: EIA, U.S. Field Production of Crude Oil, annual, released September 30, 2026.
How much US natural gas comes from fracking?
Shale gas wells brought up 35.1 trillion cubic feet of natural gas in 2024, which is 76.5% of the 45.9 trillion cubic feet withdrawn from all US wells, computed from EIA’s two figures. These are gross withdrawals.
| Year | Shale gas wells (trillion cubic feet) | All US natural gas gross withdrawals (trillion cubic feet) |
|---|---|---|
| 2007 | 1.99 | 24.66 |
| 2008 | 2.87 | 25.64 |
| 2009 | 3.96 | 26.06 |
| 2010 | 5.82 | 26.82 |
| 2011 | 8.50 | 28.48 |
| 2012 | 10.53 | 29.54 |
| 2013 | 11.93 | 29.52 |
| 2014 | 13.97 | 31.41 |
| 2015 | 15.82 | 32.91 |
| 2016 | 17.85 | 32.59 |
| 2017 | 19.93 | 33.29 |
| 2018 | 23.98 | 37.33 |
| 2019 | 27.84 | 40.78 |
| 2020 | 28.90 | 40.73 |
| 2021 | 30.36 | 41.68 |
| 2022 | 32.48 | 43.70 |
| 2023 | 34.56 | 45.40 |
| 2024 | 35.11 | 45.87 |
Source: EIA, U.S. Natural Gas Gross Withdrawals from Shale Gas and EIA, U.S. Natural Gas Gross Withdrawals, converted from million cubic feet and rounded to 0.01 trillion cubic feet. EIA’s shale series ends in 2024.
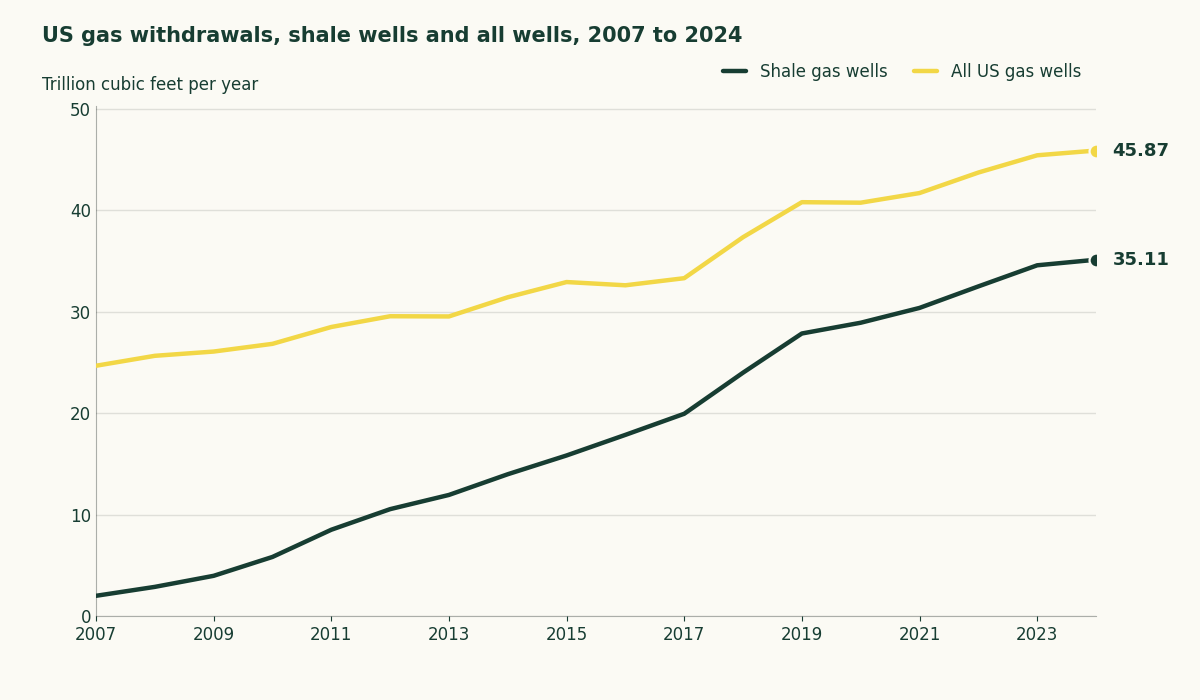
By the same computation, shale wells were 8.1% of the total in 2007 and 21.7% in 2010.
Oil wells make gas too. In the Bakken, Eagle Ford and Permian, gas was 40% of output in 2024, up from 29% in 2014, measured in barrels of oil equivalent.
EIA’s outlook tables count something different, dry shale gas by formation, so they shouldn’t be set against gross withdrawals. For how shale changed gas prices and power plants, see how shale gas changed the US energy market.
Where does fracking happen in the US?
The Permian Basin leads oil, and its shale and tight formations made 44% of US crude in December 2025. The Marcellus leads shale gas in the table below, which counts by rock formation, and formations cross state lines.
| Formation | Tight oil, 2025 (million barrels per day) | Shale dry natural gas, 2025 (billion cubic feet per day) |
|---|---|---|
| Permian | 5.97 | 21.5 |
| Marcellus | n/a | 26.9 |
| Haynesville | n/a | 13.2 |
| Bakken | 1.20 | 2.7 |
| Eagle Ford | 1.03 | 4.3 |
| Utica | n/a | 6.8 |
| Niobrara Codell | 0.47 | 2.9 |
| Woodford | 0.08 | 2.6 |
| Mississippian | 0.12 | 2.2 |
| Barnett | n/a | 1.6 |
| Fayetteville | n/a | 0.8 |
| Austin Chalk | 0.12 | n/a |
| Other U.S. formations | 0.37 | 3.5 |
| Total U.S. | 9.35 | 88.9 |
Source: EIA, Short-Term Energy Outlook Table 10b, September 2026. Rows may not sum to the totals because EIA rounds each line independently.
EIA ranks Appalachia, which holds the Marcellus and Utica, second among the world’s gas-producing areas at 33 billion cubic feet a day in 2023.
The state table below counts all production in each state, including wells that were never fracked.
| State | Crude oil production, 2025 (thousand barrels per day) | Marketed natural gas production, 2025 (million cubic feet) |
|---|---|---|
| Texas | 5,761 | 12,656,556 |
| New Mexico | 2,205 | 4,130,971 |
| North Dakota | 1,171 | 1,197,922 |
| Colorado | 475 | 1,869,619 |
| Pennsylvania | 12 | 7,675,792 |
| West Virginia | 41 | 3,599,989 |
| Louisiana | 74 | 3,813,990 |
| Oklahoma | 404 | 2,877,738 |
| Ohio | 137 | 2,100,726 |
Source: EIA, Crude Oil Production by state and EIA, Natural Gas Marketed Production by state, annual 2025 values.
Texas leads both columns. Pennsylvania ranks second for marketed gas among these nine states and last for oil.
Where is fracking regulated or banned?
Pennsylvania’s Act 13 was signed into law on February 14, 2012 and created an impact fee on unconventional gas wells. In 2026 the state’s utility commission distributed $243.8 million for the 2025 reporting year, and $133.8 million of it went to counties and municipalities directly affected by drilling. If drilling is happening in your Pennsylvania county, your local government is likely among the recipients.
Texas took a different route. Its Railroad Commission implemented a chemical disclosure rule on February 1, 2012, and the rule text names FracFocus, developed by the Ground Water Protection Council and the Interstate Oil and Gas Compact Commission, as the registry where operators post. The same rule lets suppliers claim a chemical’s name as a trade secret.
New York went further. In December 2014, Governor Andrew Cuomo banned fracking across New York State, which holds large gas reserves in the Marcellus Shale. In February 2021, all four Delaware River Basin states voted to ban the practice in the watershed, citing scientific evidence that fracking has polluted drinking water, surface water and groundwater.
| Year | Place | Action |
|---|---|---|
| 2012 | Texas | Chemical disclosure rule takes effect (Feb 1) |
| 2012 | Pennsylvania | Act 13 impact fee signed (Feb 14) |
| 2014 | New York | Statewide ban |
| 2021 | Delaware River Basin | Commission votes to ban fracking |
Source: Railroad Commission of Texas, Pennsylvania Public Utility Commission, ProPublica and WHYY.
What are the benefits of fracking?
The US has led the world in natural gas production since 2009, according to EIA, and the history table above shows shale wells behind that growth.
Burning natural gas makes fewer emissions of nearly all air pollutants and carbon dioxide than burning coal or petroleum products for the same energy. EIA puts coal at more than 200 pounds of carbon dioxide per million Btu and fuel oil at more than 160 pounds. That comparison counts the burning of the fuel and leaves out leaks, which are covered below.
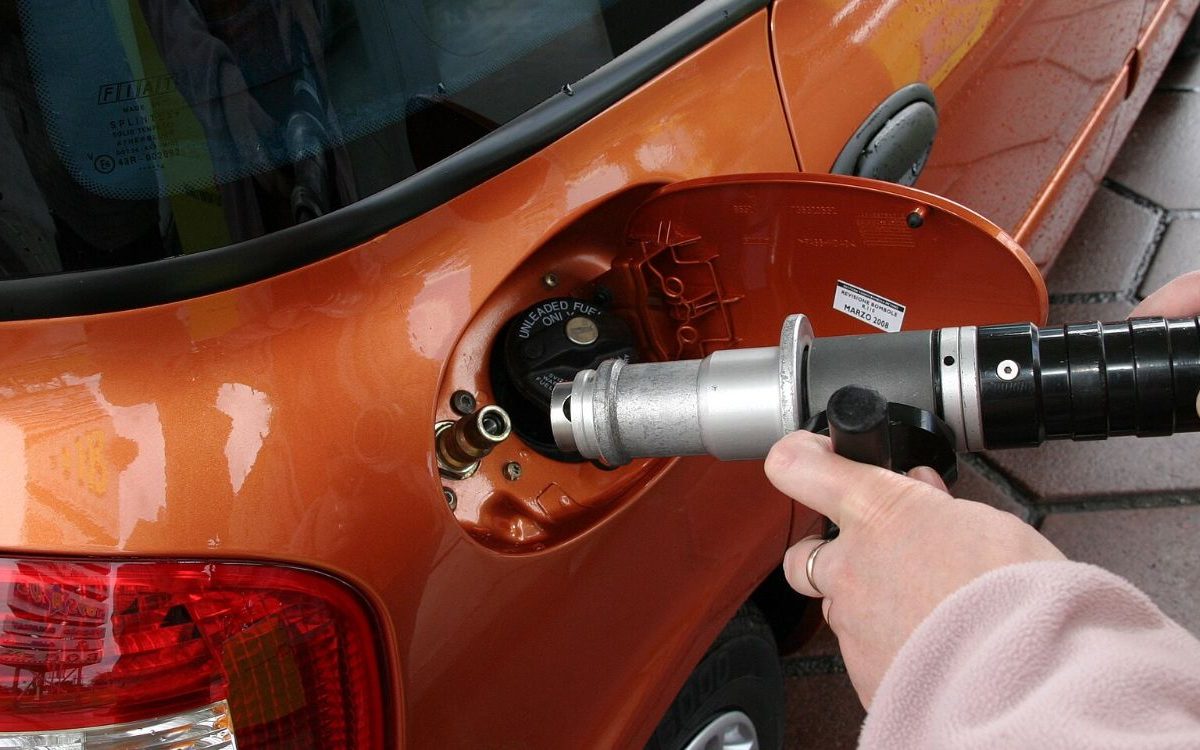
Some of that gas fuels vehicles, and the page on natural gas vehicles covers the ones that run on it.
Does fracking cause earthquakes?
USGS says reports of hydraulic fracturing causing felt earthquakes are extremely rare. It adds that most induced earthquakes are not directly caused by fracking and that the rise in central US earthquakes is primarily caused by disposal of waste fluids that are a byproduct of oil production.
If you live in the central United States and feel a tremor, USGS points to wastewater disposal wells as the main cause. The page on how much water fracking uses covers disposal in detail.
What does fracking do to water, air and health?
EPA’s 2016 assessment found scientific evidence that activities in the hydraulic fracturing water cycle can impact drinking water resources under some circumstances. In its sample, 13 of 151 characterized spills of fracturing fluid reached a surface water body.
A 2013 study in northeastern Pennsylvania found methane concentrations six times higher and ethane 23 times higher at homes within a kilometer of a shale gas well. If your water comes from a private well that close to a drilling pad, that’s the distance where the researchers saw the difference. The finding covered a subset of wells.
On air, EPA says the oil and natural gas sector is the largest industrial source of US methane emissions. A study of 2015 data put the sector’s methane at 13 million metric tons a year, 60% more than EPA’s inventory estimated.
That covers the whole oil and gas system, so fracking is one part of it. The guide to methane leaks from US oil and gas goes through the measurements.
Researchers who analyzed more than 1.1 million Pennsylvania births from 2004 to 2013 found a 25% higher probability of low birth weight for mothers living within 1 km of a fracking site. They found little evidence of effects beyond 3 km. If your home is within a kilometer of a well pad, that’s the group the study describes. It’s one study in one state.
Where these numbers come from
We compiled the figures from EIA data pages and outlooks, other federal agencies, FracFocus, state regulators and peer-reviewed studies, and we checked the linked pages in September 2026.
Some numbers are computed. Each shale share of gross withdrawals divides EIA’s shale gas figure by its all-wells figure. The 2025 tight oil share divides EIA’s tight oil estimate by its US field production figure. The gas history table converts EIA’s million cubic feet into trillions.
Shares of dry or marketed gas use different denominators and will differ from the gross withdrawals share. EIA’s fractured-well count and its tight-oil count use different definitions, so the oil table labels each row. The state table covers all production in each state, including wells that were never fracked.
What the rig count and EIA’s forecasts say about the next wells
Baker Hughes counted 455 oil rigs and 135 gas rigs in the US in the week published on September 25, 2026.
EIA’s January 2026 outlook forecast that US crude oil production would dip 2% to 13.3 million barrels a day in 2027, and it said low crude oil prices reduce operators’ incentives to drill.
For gas, EIA’s February 2026 outlook forecast marketed production of 120.8 billion cubic feet a day in 2026 and a record 122.3 in 2027. About 69% of that comes from Appalachia, Haynesville and the Permian. EIA’s April 2026 outlook expected LNG exports to average 17.0 billion cubic feet a day in 2026.
FracFocus describes its database of chemical disclosures as a public resource for consumers wishing to explore this data. If a rig goes up near you, that’s where to look up what went into the well, provided its operator posted the ingredients.