The average US home used 10,359 kWh of electricity in 2024, or 863 kWh a month, by EIA’s count of what utilities sold to residential customers. Your own number could run well above or below that, depending on where you live and how big your home is.
Top household electricity statistics
- US homes bought 1.51 trillion kWh in 2025, 37.3% of all retail electricity sales.
- In 2022, Louisiana customers bought 14,774 kWh against 6,178 kWh in Hawaii, the highest and lowest of any state.
- About 89% of US homes used air conditioning in 2020, up from 57% in 1980.
- Devices that draw power around the clock add up to 5% to 10% of residential electricity use, Lawrence Berkeley National Laboratory (LBNL) says.
- EIA forecasts an average residential price of 18 cents per kWh for 2026, up about 37% from 2020, Utility Dive reports.
- Per-person home electricity use fell 5% between 2010 and 2020 after rising about 3% a year from 1960 to 2010.
How many kWh does a house use?
The answer shifts with the source. EPA’s calculator uses 12,194 kWh per home for 2022, from 1,541 billion kWh spread across 126.4 million homes. EIA’s FAQ puts the same year lower, at 10,791 kWh per utility customer, and its energy explainer says the average household uses about 10,500 kWh a year.
EPA divides by homes, while EIA’s sales figure divides by the customers that utilities bill. When you compare your house with an average, check which count it came from, and which year.
Daily use is the number a battery gets measured against, whether it’s a Powerwall or a portable power station for home backup. One 13.5 kWh Powerwall holds about half a day of an average home’s use, in nominal capacity. If you’re sizing backup power, the page on a home battery backup system covers what a battery can run.
What is the average kWh usage per month?
The average US home used 863 kWh a month in 2024, or about 28 kWh a day. Homes use far more electricity in some months than in others. US homes bought 168.0 billion kWh in July 2025 against 97.3 billion in April, in EIA’s preliminary monthly data.
Each row below is a total for all US homes together, so read the table for the shape of the year.
| Month | Billion kWh sold to homes |
|---|---|
| January | 152.3 |
| February | 127.5 |
| March | 109.0 |
| April | 97.3 |
| May | 104.9 |
| June | 135.8 |
| July | 168.0 |
| August | 155.2 |
| September | 126.8 |
| October | 107.3 |
| November | 101.2 |
| December | 129.7 |
Source: EIA, Electric Power Monthly, Table 5.1 (2025 values are preliminary).
July’s total was about 1.7 times April’s, so if your July bill runs far above your April bill, that matches the national pattern. The end-use table further down shows how much of a year’s use goes to cooling and heating.
Which states use the most electricity?
Louisiana’s residential customers used the most electricity in 2024, 1,201.8 kWh a month on average. Hawaii’s used the least, and Hawaiian Electric builds its typical residential bill around 500 kWh a month on Oahu, Hawaii Island and Maui and 400 kWh on Lanai and Molokai.
The table lists the ten states at each end of the ranking, with each one’s price and average bill.
| State | kWh per month | Price (cents per kWh) | Monthly bill ($) | Rank |
|---|---|---|---|---|
| Louisiana | 1,201.8 | 11.73 | 140.96 | 1 |
| Mississippi | 1,155.9 | 13.39 | 154.83 | 2 |
| Tennessee | 1,153.6 | 12.42 | 143.32 | 3 |
| Alabama | 1,143.2 | 15.18 | 173.50 | 4 |
| Florida | 1,104.1 | 14.14 | 156.09 | 5 |
| Texas | 1,096.1 | 14.94 | 163.72 | 6 |
| Oklahoma | 1,079.1 | 12.24 | 132.05 | 7 |
| Arizona | 1,074.9 | 14.91 | 160.24 | 8 |
| Georgia | 1,074.0 | 14.08 | 151.25 | 9 |
| South Carolina | 1,050.4 | 14.23 | 149.51 | 10 |
| New Hampshire | 619.0 | 23.40 | 144.87 | 42 |
| Michigan | 618.2 | 19.30 | 119.31 | 43 |
| Alaska | 578.3 | 24.82 | 143.54 | 44 |
| Vermont | 573.7 | 21.90 | 125.66 | 45 |
| New York | 571.2 | 24.43 | 139.53 | 46 |
| Massachusetts | 569.7 | 29.35 | 167.20 | 47 |
| Rhode Island | 566.9 | 28.65 | 162.40 | 48 |
| Maine | 550.1 | 24.29 | 133.60 | 49 |
| California | 503.2 | 31.97 | 160.86 | 50 |
| Hawaii | 494.9 | 42.86 | 212.12 | 51 |
Source: EIA, 2024 Average Monthly Bill, Residential (Table 5A, Form EIA-861).
Low use doesn’t mean a low bill. Hawaii uses less than half what Louisiana does and still pays the bigger bill, as the price column shows.
These are electricity purchases, so a home that runs on its own rooftop solar shows up as using less. EIA’s FAQ shows the size of the effect in Hawaii, where a 2020 survey put household use at 7,976 kWh against 6,446 kWh purchased.
How do home type and size change the number?
In EIA’s 2020 home survey, the largest homes used 15,475 kWh, more than twice the 6,800 kWh of the smallest. The survey reports energy in Btu, so the tables here convert it to kWh.
| Home size (sq ft) | Homes (million) | kWh per home per year |
|---|---|---|
| Less than 1,000 | 30.01 | 6,800 |
| 1,000 to 1,499 | 28.08 | 9,408 |
| 1,500 to 1,999 | 22.22 | 11,020 |
| 2,000 to 2,499 | 15.62 | 12,163 |
| 2,500 to 2,999 | 10.31 | 13,042 |
| 3,000 or more | 17.29 | 15,475 |
| All homes | 123.53 | 10,580 |
Source: EIA, Residential Energy Consumption Survey 2020, Table CE2.1, converted at the standard 3,412 Btu per kWh.
Find your square-footage band in the table and you have a rough benchmark for your own bill. For scale, the median single-family home completed in 2025 had 2,142 square feet.
Type matters as much as size. A detached house uses about twice what an apartment in a large building does, and a mobile home uses about as much as a detached house.
| Home type | Homes (million) | kWh per home per year |
|---|---|---|
| Single-family detached | 77.07 | 12,397 |
| Single-family attached | 7.45 | 8,441 |
| Apartment in a 2 to 4 unit building | 9.34 | 6,653 |
| Apartment in a 5 or more unit building | 22.84 | 6,096 |
| Mobile home | 6.83 | 12,456 |
| All homes | 123.53 | 10,580 |
Source: EIA, Residential Energy Consumption Survey 2020, Table CE2.1, converted at the standard 3,412 Btu per kWh.
What uses the most electricity in a home?
Air conditioning is the biggest single use, at 19% of home electricity in 2020, with space heating and water heating at 12% each. Lighting and refrigerators come next.
| End use | Share of home electricity (%) | kWh per year per home that uses it |
|---|---|---|
| Air conditioning | 19.4 | 2,318 |
| Space heating | 12.3 | 2,484 |
| Water heating | 12.0 | 2,706 |
| All refrigerators | 7.9 | 839 |
| Lighting | 6.2 | 654 |
| All TVs and related | 5.8 | 632 |
| Clothes dryers | 4.3 | 680 |
| Air handlers for cooling | 2.9 | 457 |
| Cooking | 1.8 | 290 |
| Dehumidifiers | 1.6 | 999 |
| Ceiling fans | 1.5 | 227 |
| Pool pumps | 1.5 | 2,384 |
| Dishwashers | 0.7 | 112 |
| EV charging | 0.2 | 2,363 |
| Everything else | 21.8 | n/a |
Source: EIA, Residential Energy Consumption Survey 2020, Table CE4.1, Table CE5.1a, Table CE5.1b and Table CE5.3a, converted at the standard 3,412 Btu per kWh. Shares are of 4,453 trillion Btu, the survey’s electricity total, and the last row is what the listed uses leave over.
EIA’s earlier survey put cooling at a similar share, 18% of household electricity use in 2015.
New homes lean electric. Among single-family homes completed in 2025, 56% were fueled with electricity. In the South, 63% had a heat pump. The page on electric heat pumps shows how those machines work.
A drafty house pushes up the heating share, and the guide to the sources of home heat loss shows where the heat escapes.
Small loads add up too. ENERGY STAR certified refrigerators are about 9% more efficient than models that only meet the federal minimum, and an ENERGY STAR electric clothes dryer saves about $210 in energy bills over its life. The devices that stay on all day are covered in what energy waste costs.
A car is the newest load. Homes that charged an electric vehicle at home used 2,363 kWh a year for it in 2020, and the Department of Energy’s worked example is a car that uses 27 kWh per 100 miles.
How has household electricity use changed over time?
Use per customer climbed from 8,978 kWh in 1984, peaked in 2010 and has drifted lower since.
| Year | US average | Louisiana | Hawaii |
|---|---|---|---|
| 2000 | 10,674 | 15,242 | 7,505 |
| 2001 | 10,459 | 14,139 | 7,473 |
| 2002 | 10,849 | 15,232 | 7,715 |
| 2003 | 10,878 | 15,328 | 7,847 |
| 2004 | 10,879 | 15,223 | 8,120 |
| 2005 | 11,256 | 15,087 | 8,009 |
| 2006 | 11,035 | 15,136 | 7,925 |
| 2007 | 11,232 | 15,314 | 7,861 |
| 2008 | 11,042 | 15,025 | 7,531 |
| 2009 | 10,900 | 15,278 | 7,401 |
| 2010 | 11,500 | 16,562 | 7,211 |
| 2011 | 11,279 | 16,178 | 7,014 |
| 2012 | 10,837 | 15,046 | 6,528 |
| 2013 | 10,916 | 15,270 | 6,176 |
| 2014 | 10,936 | 15,497 | 6,077 |
| 2015 | 10,816 | 15,435 | 6,166 |
| 2016 | 10,766 | 14,881 | 6,061 |
| 2017 | 10,399 | 14,242 | 6,074 |
| 2018 | 10,972 | 15,379 | 6,213 |
| 2019 | 10,649 | 14,787 | 6,296 |
| 2020 | 10,715 | 14,407 | 6,446 |
| 2021 | 10,632 | 14,302 | 6,369 |
| 2022 | 10,791 | 14,774 | 6,178 |
| 2023 | 10,263 | 14,854 | 6,036 |
| 2024 | 10,359 | 14,422 | 5,938 |
Source: EIA, Historical state data, Form EIA-861, 1990 to 2009 file and 2010 and later file. Each figure is residential sales divided by residential customers.
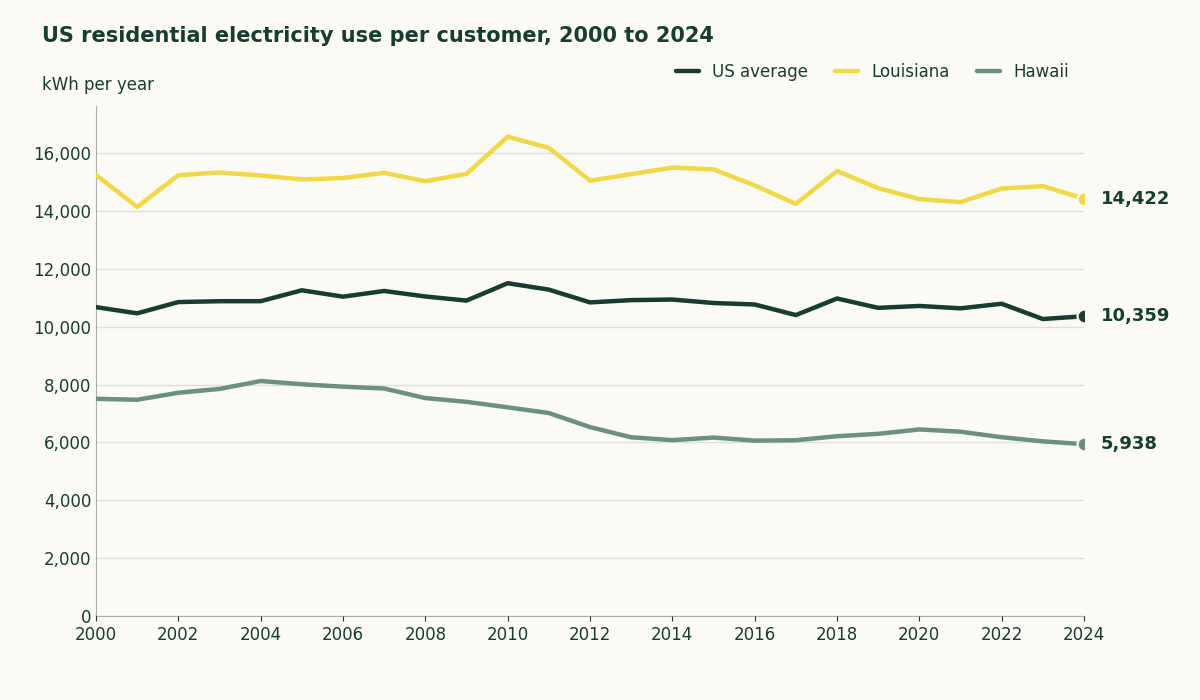
EIA’s per-person numbers turn at the same point. Residential sales per person fell 5% between 2010 and 2020, to 4,437 kWh in 2020, after rising about 3% a year over the half century before.
Louisiana’s line stays high through the whole span, and Hawaii’s slopes down. Hawaii’s figures count purchases, so rooftop solar lowers them.
Total retail electricity sales, which include business and industry, kept growing. They grew 0.2% a year from 2010 to 2019 and then 1.1% a year from 2019 to 2025, LBNL found, and the faster growth came largely from commercial and industrial customers.
What does the average house pay for it?
The average bill for a US home was $142.26 a month in 2024, at 16.48 cents per kWh. LBNL found that the average residential bill was 2.4% of household spending in 2025. The report’s March edition measured total residential electricity costs against personal spending instead and got 1.25% for 2025, a figure EEI, the trade group for investor-owned utilities, passed along as 1.25 percent of household spending.
EIA’s 2023 analysis put the average monthly residential bill at $137 in 2022, up from $121 in 2021, before inflation.
EIA forecasts the 2026 average residential price at 18 cents per kWh, up about 37% from 2020, Utility Dive reports. At 18 cents a kWh, every 100 kWh your home uses costs $18.
The American Council for an Energy-Efficient Economy found that one in four low-income households spend over 15% of income on energy bills.
Where these numbers come from
We computed per-customer use by dividing EIA’s residential sales by its residential customers for each year. Monthly figures divide that by twelve. Daily figures divide it by the 366 days of 2024, which was a leap year, and come to about 28 kWh whichever way you count the year. We converted EIA’s home survey from Btu to kWh at its standard factor.
The 2025 monthly figures are EIA’s preliminary estimates, and EIA hasn’t published a 2025 customer count, so the annual figure stays at 2024. Survey-based figures describe 2020, the newest year with a published end-use breakdown, and EIA will publish 2024 consumption by end use in spring 2027.
How to find your own kWh number
Your bills already hold the answer. Add up a full year of kWh, divide by the months and compare that monthly average with your state’s row in the table above and with the size band that fits your home.
If you come out well over, start with cooling. Heating and water heating come next in the end-use table.
Top photo: 277volts, CC BY-SA 4.0, via Wikimedia Commons, cropped.