The average US customer went without power for 11 hours in 2024 with major events and about two hours without, according to EIA. Major events account for most of that time, and the totals vary widely by state. The figures below come mostly from EIA and DOE data, and they describe 2024 unless a line says otherwise.
Top US power outage statistics
- US customers averaged 11 hours of power outages in 2024, nearly twice the annual average of the previous decade, EIA reported in December 2025.
- Major events such as hurricanes accounted for 80% of the hours without electricity in 2024.
- South Carolina customers averaged 53 hours of interruptions in 2024, the most of any state.
- The average customer’s longest outage grew from 8.1 hours in 2022 to 12.8 hours by mid-2025, J.D. Power’s survey found.
- Weather caused 80% of major US outages from 2000 to 2023, according to Climate Central’s analysis of federal reports.
- Hurricane Helene’s outages peaked at 4.6 million customers on September 27, 2024, and 96% had power back by October 8.
- Winter Storm Uri cut power to more than 4.5 million people in Texas in February 2021, some for as long as four days.
- Power interruptions cost the US economy about $44 billion a year in 2015 dollars, Berkeley Lab estimated in 2018.
How long do power outages last?
The average outage lasted 7.2 hours with major events and 2.1 hours without in 2024, counting utilities that report under the IEEE standard. EIA calls this measure CAIDI, the average number of minutes it takes to restore service after an interruption, and the gap between the two figures is the storm outages.
J.D. Power’s survey measures something different, the longest outage each customer experienced. In the first half of 2025, 45% of customers reported an outage.
If you live in the South, the survey found the longest outages averaged 18.2 hours, and the West came next at 12.4. Of the outages respondents reported, nearly half were due to extreme weather.
For you, that means an outage in a calm year runs about two hours on average, and a storm year can run far longer.
How many hours a year does the average customer lose?
EIA calls 2024 the year with the most hours without electricity in 10 years. The table gives each year’s average per customer for utilities that report under the IEEE standard. If you’re comparing a storm year with a calm one, the no-major-events columns are the baseline.
| Year | Hours, all events | Hours, no major events | Interruptions, all events | Interruptions, no major events |
|---|---|---|---|---|
| 2014 | 3.9 | 1.9 | 1.257 | 1.038 |
| 2015 | 3.5 | 1.9 | 1.275 | 1.073 |
| 2016 | 4.5 | 2.0 | 1.327 | 1.082 |
| 2017 | 8.4 | 1.9 | 1.42 | 1.023 |
| 2018 | 5.8 | 2.0 | 1.34 | 1.051 |
| 2019 | 4.9 | 2.0 | 1.332 | 1.04 |
| 2020 | 7.6 | 1.9 | 1.385 | 1.013 |
| 2021 | 7.9 | 2.1 | 1.436 | 1.039 |
| 2022 | 5.5 | 2.2 | 1.426 | 1.09 |
| 2023 | 6.1 | 2.1 | 1.348 | 1.022 |
| 2024 | 11.0 | 2.2 | 1.531 | 1.065 |
Source: EIA, Electric Power Annual 2024, Table 11.1. Hours are EIA’s minutes divided by 60. IEEE-method utilities reported 79.3% of customers in 2024.
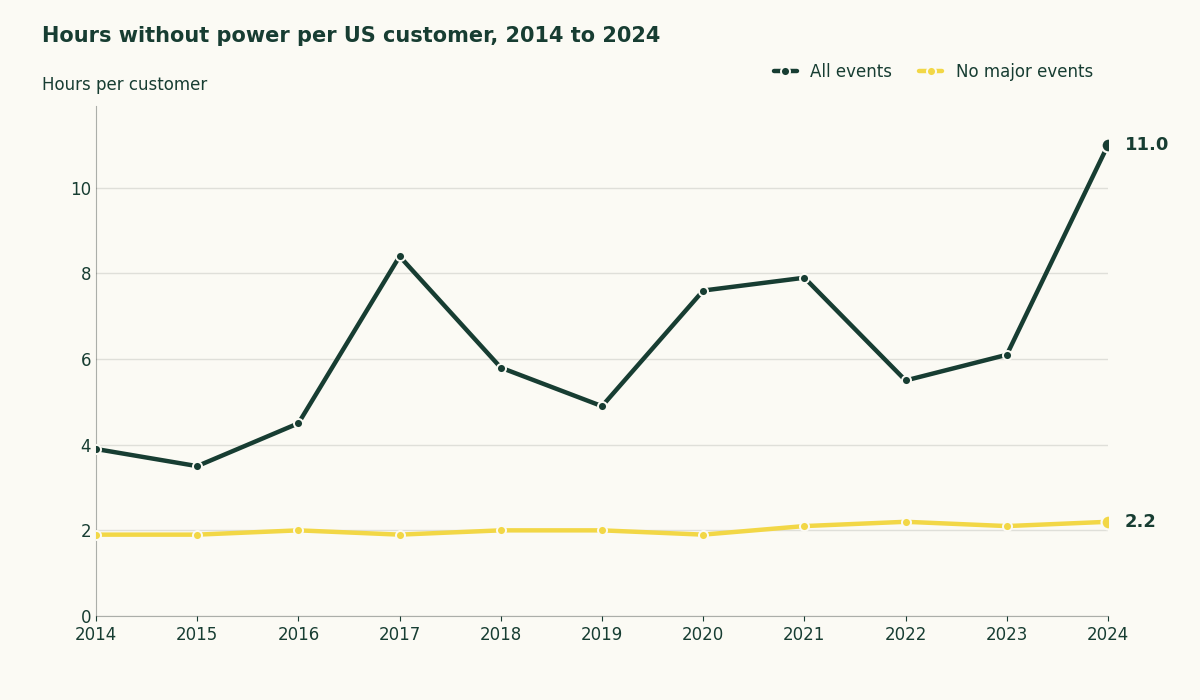
Without major events, the yearly average has stayed around two hours since 2013. Major events move the total, as in 2022, when customers averaged five and one-half hours.
EIA’s 2021 article put 2020 at more than eight hours, the most since it began collecting the data in 2013, and the table above, from the 2024 edition, lists that year lower. In 2019 customers lost 3.2 hours to major events and 1.5 hours otherwise.
EIA’s 2018 article reported 7.8 hours for 2017, against 8.4 in the 2024 edition. The older articles and the 2024 edition give different figures for the same years, so this page uses the 2024 edition throughout.
Customers also lose power often. The average customer had 1.5 interruptions in 2024. In years with no major events the count barely moves from year to year, as the last column shows.
Which states lose power the longest?
South Carolina customers averaged 3,136.5 minutes without power in 2024, or 52.3 hours, the most of any state.
| State | Hours, all events | Hours, no major events | Interruptions, all events | Average outage (hours) | Customers reported (%) |
|---|---|---|---|---|---|
| South Carolina | 52.3 | 2.0 | 2.365 | 22.1 | 96.5 |
| Maine | 29.1 | 4.6 | 3.636 | 8.0 | 100.3 |
| North Carolina | 24.0 | 2.4 | 1.812 | 13.2 | 96.0 |
| Florida | 22.0 | 1.1 | 1.77 | 12.4 | 100.4 |
| Texas | 21.2 | 2.2 | 2.114 | 10.0 | 98.1 |
| Georgia | 20.5 | 3.5 | 2.122 | 9.7 | 88.9 |
| West Virginia | 19.4 | 8.1 | 2.832 | 6.9 | 97.3 |
| New Hampshire | 15.4 | 2.2 | 2.021 | 7.6 | 99.2 |
| Louisiana | 12.1 | 3.4 | 2.722 | 4.5 | 93.5 |
| Vermont | 11.6 | 4.6 | 2.516 | 4.6 | 87.0 |
Source: EIA, Electric Power Annual 2024, Table 11.3. Hours are EIA’s minutes divided by 60, and average outage is EIA’s restoration time per interruption.
A state’s total can swing from year to year. Connecticut went from 93.7 minutes in 2014 to 3,033.8 in 2020 and back to 152.8 in 2024.
Maine’s worst year in EIA’s series was 2017, at 2,492.6 minutes.
Find your state in these tables and read its second column against its third. The gap between them is how much of your outage time came from major events.
Which states lose power the least?
Arizona, South Dakota, North Dakota and Massachusetts each averaged under two hours without power in 2024.
| State | Hours, all events | Hours, no major events | Interruptions, all events | Average outage (hours) | Customers reported (%) |
|---|---|---|---|---|---|
| South Dakota | 1.4 | 1.0 | 0.815 | 1.7 | 75.4 |
| Arizona | 1.5 | 1.2 | 0.988 | 1.5 | 96.6 |
| North Dakota | 1.7 | 1.4 | 0.915 | 1.8 | 88.5 |
| Massachusetts | 1.7 | 1.3 | 0.843 | 2.0 | 92.3 |
| Rhode Island | 1.7 | 1.0 | 0.896 | 1.9 | 97.6 |
| Delaware | 1.9 | 1.1 | 0.843 | 2.3 | 89.1 |
| Maryland | 2.0 | 1.3 | 0.817 | 2.4 | 98.6 |
| Utah | 2.0 | 1.8 | 1.03 | 1.9 | 88.3 |
| Wyoming | 2.3 | 1.8 | 0.999 | 2.3 | 76.0 |
| Connecticut | 2.6 | 1.2 | 0.876 | 2.9 | 101.2 |
Source: EIA, Electric Power Annual 2024, Table 11.3. Hours are EIA’s minutes divided by 60. The District of Columbia, which isn’t a state, is left out of the ranking.
South Dakota and Wyoming rest on a smaller sample of customers, as the last column shows.
What are the biggest US power outages?
Hurricane Helene left nearly 6 million customers in 10 states without power in September 2024, more than any other storm in the table below. DOE’s region-wide peak of 4.6 million is the most customers out at one time, so the two counts measure different things.
| Event | Date | Customers out (millions) | What the count measures |
|---|---|---|---|
| Hurricane Helene | Sept 2024 | 4.6 | Region-wide peak |
| Hurricane Milton | Oct 2024 | 3.4 | Florida, Oct 10 count |
| Hurricane Ian | Sept 2022 | 2.7 | Florida peak |
| Hurricane Beryl | July 2024 | 2.6 | Texas, at the height |
| Winter Storm Fern | Jan 2026 | 1.1 | Peak, 10 states |
Source: DOE Hurricane Helene Situation Report #12, Utility Dive on Milton, American Public Power Association on Ian, Insurance Journal on Beryl and PowerOutage.us on Fern. Milton’s count comes from PowerOutage.us.
Hurricane Milton left 3.4 million Florida customers without power on October 10, 2024. Hurricane Ian’s peak of 2.7 million Florida customers in September 2022 was down 85% by October 4. More than 2.6 million Texas customers lost power for days after Hurricane Beryl, and fallen trees caused many of those outages.
Winter Storm Fern knocked out power to about 1.1 million customers at its peak on January 25, 2026. During Winter Storm Elliott in December 2022, Duke Energy and the Tennessee Valley Authority conducted rolling blackouts of more than 5 GW of load.
Uri and the 2003 Northeast blackout were counted in people, so they stay out of the table. FERC found that Uri cut power to more than 4.5 million people in Texas, and freezing and fuel problems caused 75.6% of the unplanned generator outages. The 2003 blackout left over 50 million people without power for up to four days.
How long did the biggest outages take to fix?
Five days after Helene’s peak, 1.2 million customers were still without power, and rural cooperative leaders warned some areas could need weeks.
By the Sunday after landfall, about 900,000 Duke Energy customers in the Carolinas were still in the dark. Georgia Power had restored 1.3 million customers, more than 95% of those affected.
CenterPoint expected 98% restoration by the end of July 17, 2024, nine days after Beryl struck southeast Texas on July 8. Florida Power and Light restored nearly 1.3 million customers within 24 hours of Milton leaving the state, about two-thirds of those affected. After Ian, Florida’s public power utilities restored 99.99% of customers able to take service within six days.
On Sunday evening, January 25, 2026, about 899,000 customers were without power after Fern, and Mississippi needed nearly two weeks to reach 98% restoration. FERC and NERC staff found no planned power outages in January in ERCOT or the Eastern Interconnection.
What causes power outages?
NERC ranked weather, excluding lightning, as the number one cause of transmission outages on extreme days in 2025. The table splits weather-related major outages into five types.
| Weather type | Share of weather-related major outages (%) | Events |
|---|---|---|
| Severe weather (wind, rain, thunderstorms) | 58 | 1,011 |
| Winter weather (snow, ice, freezing rain) | 23 | 398 |
| Tropical cyclones (including hurricanes) | 14 | 249 |
| Extreme heat | 3 | 48 |
| Wildfire | 2 | 39 |
Source: Climate Central, Weather-related Power Outages Rising. Climate Central counts major outages as events that affect at least 50,000 customers or 300 megawatts, using federal OE-417 reports.
The US had about twice as many weather-related major outages in 2014 to 2023 as in 2000 to 2009. NERC still calls major weather events the greatest risk to reliability, though 2025 was generally temperate.
For what aging lines and rising demand mean for reliability, read about the strain on the power grid.
How much do power outages cost?
Berkeley Lab estimated that sustained power interruptions cost the US about $44 billion a year in 2015 dollars, 25% more than its 2006 estimate after adjusting for the dollar year. The figure covers sustained interruptions across all customer classes.
How we compiled these numbers
We took the national and state figures from EIA’s Electric Power Annual 2024, released October 16, 2025, and the outage counts from DOE and from utility and trade-group reports. The national history uses the IEEE-method series that EIA’s own headline figure uses. The state tables use EIA’s any-method series, which covers more customers, so figures such as South Carolina’s can differ slightly from EIA’s article.
Oak Ridge National Laboratory’s county outage dataset covered 92% of customers by 2022 and doesn’t reliably capture outages under 15 minutes. Customer counts are meters, and the Uri and 2003 figures are people.
We’ll update the tables, chart and title year when EIA publishes the 2025 data, and when NERC follows its June 24, 2026 State of Reliability report with the next edition.
How long a backup plan should cover
In a year with no major events, the average customer loses about two hours. After Beryl, CenterPoint’s target for 98% restoration was July 17, nine days after landfall.
For what a home battery can carry through a gap like the second one, see battery backup for home power outages, and for a short one like the first, see portable power stations for short outages. Find your state in the tables above, note how far its all-events hours sit above its no-major-events hours, and size your plan to that gap.