Stopping global warming means cutting greenhouse gas emissions to net zero, and the IPCC’s 1.5°C pathways reach net zero CO2 in the early 2050s after a 43% cut in all greenhouse gases from 2019 levels by 2030. Some of that cutting already costs less than the alternative, and in 2025 more than 90% of new utility-scale renewable capacity generated power for less than the cheapest new fossil-fuel plant.
The figures below come mostly from the IPCC, Ember, IRENA and the Global Carbon Project and describe 2025 unless a line says otherwise.
Top statistics on stopping global warming
- Carbon dioxide at Mauna Loa averaged 426.07 ppm in September 2026, up from 424.37 ppm in September 2025.
- Global fossil CO2 emissions rose 1.0% in 2025 to a record 38.1 billion tonnes.
- Wind and solar supplied 17.3% of the world’s electricity in 2025, up from 4.5% in 2015.
- Renewables overtook coal in global electricity generation in 2025, 33.8% to 33.0%.
- The world installed a record 664 GW of solar in 2025, counted in direct current.
- Electric cars made up about 1 in 4 new cars sold worldwide in 2025, with more than 20 million sold.
- Direct carbon pricing covered over 29% of global emissions in the World Bank’s May 2026 report.
- Climate Action Tracker’s November 2025 update puts warming under current policies at about 2.6°C by the end of the century.
- Newer carbon removal methods take out only 0.002 billion tonnes of CO2 a year, according to the 2026 State of CDR report.
How fast do emissions have to fall?
In the IPCC’s 1.5°C pathways, global greenhouse gas emissions fall 60% below 2019 levels by 2035 and 84% by 2050. The 2°C pathways cut more slowly and reach net zero CO2 in the early 2070s.
| Year | 1.5°C pathways (% below 2019) | 2°C pathways (% below 2019) |
|---|---|---|
| 2030 | 43 (34 to 60) | 21 (1 to 42) |
| 2035 | 60 (49 to 77) | 35 (22 to 55) |
| 2040 | 69 (58 to 90) | 46 (34 to 63) |
| 2050 | 84 (73 to 98) | 64 (53 to 77) |
Source: IPCC, AR6 Synthesis Report, Longer Report (2023). The figures are cuts in net global greenhouse gas emissions, with the IPCC’s ranges in parentheses. The 1.5°C pathways have a better than 50% chance of limiting warming to 1.5°C with no or limited overshoot, and the 2°C pathways a better than 67% chance of limiting it to 2°C.
UNEP’s Emissions Gap Report 2025 puts the cut needed by 2035 on a 1.5°C path at 55% below 2019 levels. For a 2°C path it’s 35%, and both sit inside the IPCC’s ranges.
ECMWF’s ERA5 data show that 2023 to 2025 averaged more than 1.5°C above pre-industrial levels, the first three-year span to do so. The Paris Agreement’s 1.5°C limit refers to long-term warming, which ECMWF estimates at around 1.4°C. The gases and activities behind that warming are laid out in the causes of climate change.
The remaining carbon budget for 1.5°C is 170 billion tonnes of CO2 from the start of 2026, and the 2025 Global Carbon Budget report says current emissions would use it up before 2030.
Why do estimates of world emissions differ?
Three totals for world emissions get quoted often, and each one counts something different. The Global Carbon Budget counts only fossil CO2, which came to 38.1 billion tonnes in 2025 after netting out cement carbonation. The EU’s EDGAR database counts all greenhouse gases in CO2 equivalents without land use, which gives 54.1 billion tonnes for 2025, up 0.7% on 2024.
UNEP adds land-use change to the same set of gases and reports 57.7 billion tonnes for 2024, up 2.3% on 2023.
What would cut the most emissions by 2030?
The IPCC says mitigation options costing USD100 a tonne or less could cut global emissions by at least half of the 2019 level by 2030, and its chapter on mitigation potential puts the total at 38 billion tonnes of CO2e a year.
| Sector | Potential in 2030 (Gt CO2e a year) | Range (Gt CO2e a year) |
|---|---|---|
| Electricity | 11.0 | 7.9 to 12.5 |
| Forestry and other land use | 7.3 | 3.9 to 13.1 |
| Industry (direct emissions) | 5.4 | 4.0 to 6.7 |
| Agriculture | 4.1 | 1.7 to 6.7 |
| Transport | 3.8 | 1.9 to 5.7 |
| Land demand-side options (diets, food waste) | 2.2 | 1.1 to 3.6 |
| Buildings (direct and indirect) | 2.0 | 1.4 to 2.9 |
| Other energy (methane) | 1.6 | 1.1 to 2.1 |
| Fluorinated gases | 1.2 | 0.7 to 1.5 |
| Waste and wastewater | 0.7 | 0.6 to 0.8 |
| All sectors, net of overlap | 38 | 32 to 44 |
Source: IPCC, AR6 Working Group III, Chapter 12, Table 12.4 (2022). The potentials are for options costing under USD100 per tonne of CO2e, and the all-sector figure is net of overlap between sectors.
Electricity has the largest potential, and energy supply was also the biggest source of emissions in 2019, at 34% of the net total, with industry second at 24%. Forestry and other land use ranks second on the potential list, ahead of industry and agriculture.
Which single options cut the most for the least money?
Solar sits at the top of the IPCC’s list of single options, with a potential of 2.0 to 7.0 billion tonnes of CO2e a year in 2030, and wind comes next. Solar and wind are the two types of renewable energy on the list, and most of their potential costs less than zero.
| Option | Potential in 2030 (Gt CO2e a year) | Cost (USD per t CO2e) |
|---|---|---|
| Solar energy | 2.0 to 7.0 | Mostly below 0 |
| Wind energy | 2.1 to 5.6 | Mostly below 0 |
| Protecting natural ecosystems (stopping deforestation) | 2.28 | 0 to 20 |
| Industry: fuel switching | 1.28 | 20 to 50 |
| Industry: energy efficiency | 1.14 | 0 to 20 |
| Industry: material efficiency | 0.93 | 20 to 50 |
| Efficient lighting, appliances and equipment | 0.73 | Below 0 |
| Light-duty vehicle fuel efficiency | 0.6 | Below 0 |
| Avoiding demand for energy services in buildings | 0.56 | Below 0 |
| Shift to public transport | 0.5 | Below 0 |
| Carbon sequestration in agriculture | 0.50 | 0 to 20 |
| Methane cuts at coal mines | 0.41 | 0 to 20 |
| Methane cuts in oil and gas operations | 0.31 | Below 0 |
| Restoration and reforestation | 0.15 | 0 to 20 |
Source: IPCC, AR6 Working Group III, Chapter 12, Table 12.3 (2022). A cost below zero means the option costs less over its lifetime than the technology it replaces, and the costs leave out the expense of integrating variable power into the grid. Ranges are shown where the IPCC gives one.
The IPCC shows these options as a chart in Figure SPM.7.
How fast are wind and solar growing?
In 2025, solar out-generated wind for the first time in the table below, with 2,778.6 TWh against 2,711.9 TWh.
| Year | Wind (TWh) | Solar (TWh) |
|---|---|---|
| 2010 | 345.99 | 32.21 |
| 2011 | 439.98 | 63.56 |
| 2012 | 529.26 | 96.92 |
| 2013 | 634.14 | 131.75 |
| 2014 | 706.1 | 197.74 |
| 2015 | 829.63 | 256.01 |
| 2016 | 960.3 | 327.47 |
| 2017 | 1,139.44 | 444.65 |
| 2018 | 1,268.14 | 575.16 |
| 2019 | 1,420.96 | 697.94 |
| 2020 | 1,591.46 | 853.39 |
| 2021 | 1,856.1 | 1,053.99 |
| 2022 | 2,105.66 | 1,333.12 |
| 2023 | 2,317.14 | 1,664.16 |
| 2024 | 2,508.2 | 2,142.91 |
| 2025 | 2,711.9 | 2,778.6 |
Source: Ember, yearly electricity data (file updated September 2026).
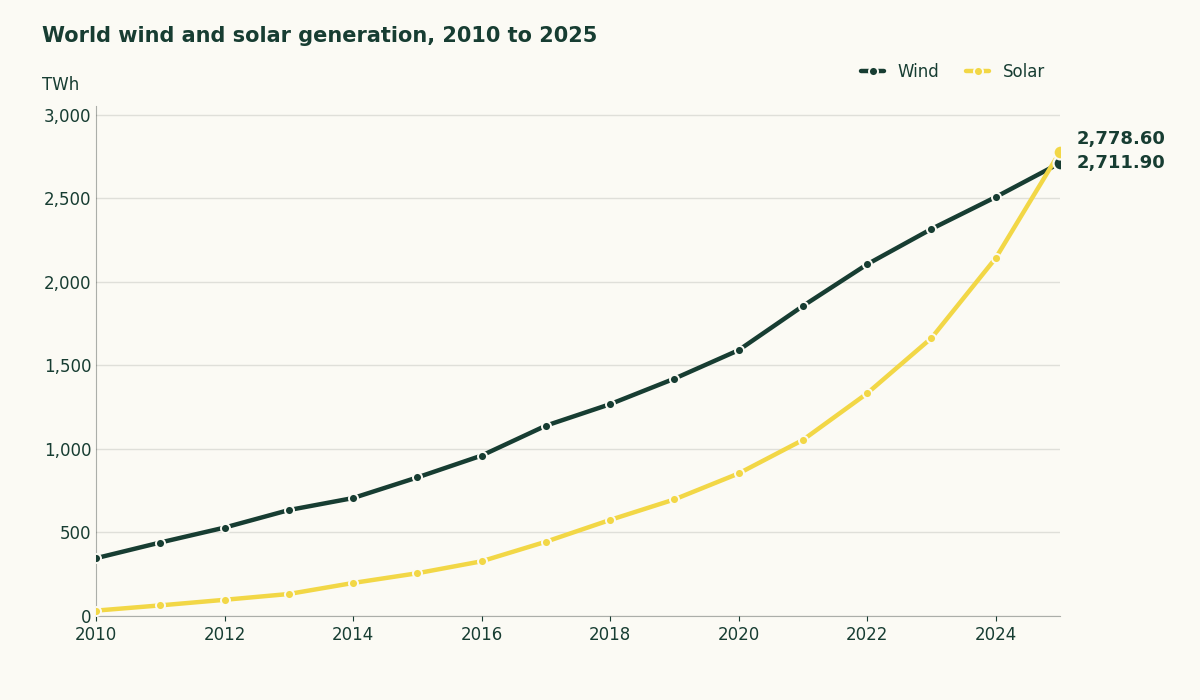
Ember’s 2026 review found that wind and solar together met 99% of the growth in global electricity demand in 2025. SolarPower Europe, an industry group, says the global solar fleet passed 3 TW in 2025.
On the wind side, the trade body GWEC counted a record 165 GW of new wind capacity in 2025, 40% more than in 2024. A separate GWEC supply-side report, as covered by Baltic Wind, counts turbines when they’re mechanically installed and gives 178 GW for the same year. US numbers are on the page about wind power growth.
Is clean power cheaper than fossil power?
IRENA finds that the cost of solar PV has fallen 89% since 2010 and the cost of onshore wind 71%.
| Technology | Cost of new power, 2025 (USD per MWh) |
|---|---|
| Onshore wind | 33 |
| Solar PV | 44 |
| Hydropower | 62 |
| Offshore wind | 78 |
| Bioenergy | 86 |
| Geothermal | 89 |
| Concentrated solar power | 115 |
Source: IRENA, Renewable Power Generation Costs in 2025 (2026). The figures are global weighted averages for projects commissioned in 2025, in 2025 dollars.
Onshore wind and solar PV sit at the cheap end of the table. These are the costs of building and running a plant, not the price on your power bill, and they leave out storage and the cost of connecting plants to the grid.
IRENA’s 2024 edition, as reported by Argus Media, put onshore wind at USD0.034 a kWh, 53% below the cheapest fossil option.
How do cars, homes and factories fit in?
A battery-electric car emits 73% less over its life cycle than a gasoline car in the EU, according to the ICCT’s 2025 update, and up to 78% less when it runs on renewable electricity. If you drive a typical US gasoline car, it emits 4.29 tonnes of CO2e a year.
The IEA’s May 2026 outlook, as reported by Electrek, expects 23 million electric cars to be sold in 2026, close to 30% of new cars worldwide.
In buildings, the IPCC’s chapter on the sector names the spread of heat pumps as the main driver of electricity use for heating. For industry, it calls net zero carbon dioxide emissions possible but challenging, and says material efficiency and circularity cut the need for primary production.
How much do methane and forests matter?
Methane made up 17.6% of global greenhouse gas emissions in 2025, by EDGAR’s count. It’s about 80 times as potent as CO2 per unit of mass over 20 years, and the Global Methane Pledge aims to cut methane at least 30% from 2020 levels by 2030.
Methane cuts at oil and gas operations and at coal mines both appear in the options table above. The page on methane leaking from oil and gas covers where the gas escapes.
On forests, the world lost 4.3 million hectares of tropical primary forest in 2025, 36% less than in 2024, though the loss is still 46% higher than a decade earlier.
Can carbon removal fill the gap?
The world removes 2.2 billion tonnes of CO2 a year, about 5% of gross CO2 emissions, and 99.9% of that comes from conventional methods such as forests and soils. National pledges for CO2 removal fall short of the highest-ambition Paris-compatible scenarios by 1.2 billion tonnes a year in 2035 and 5.2 in 2050.
The Global CCS Institute counted 77 operating carbon capture projects in its October 2025 report, up 54% on the year. The page on how much carbon capture and storage captures gives the tonnes. Climeworks’ Mammoth plant in Iceland, which started up in May 2024, is designed to capture up to 36,000 tons of CO2 a year.
What are governments doing about emissions?
137 countries have net zero targets covering 74% of global emissions, as of October 2026, according to the Net Zero Tracker. The World Bank’s May 2026 report found that direct carbon pricing covers over 29% of global emissions, with revenues above USD107 billion in 2025. The page on how carbon pricing works covers the markets in the EU and California.
Climate Action Tracker’s November 2025 update puts current policies at about 2.6°C of warming by the end of the century and at about 2.2°C if governments deliver their binding long-term and net-zero targets. UNEP’s 2025 report projects 2.3 to 2.5°C if every national pledge is carried out and up to 2.8°C under current policies. The two groups model the outlook separately, so their current-policy figures differ.
China shows how a projection and a full-year count can differ. The Global Carbon Project’s November 2025 projection had China’s emissions up 0.4% in 2025, and CREA’s later analysis found they fell about 0.3%.
Which personal choices cut the most CO2?
Living car-free saves 2.4 tonnes of CO2e a year and a plant-based diet saves 0.8, according to Wynes and Nicholas’s 2017 study of developed-country lifestyles. Their paper found that commonly promoted strategies such as recycling are four times less effective than a plant-based diet.
A 2020 review of 53 studies by Ivanova and colleagues found that car-free living and an electric car each save a median of more than 1.7 tonnes per person a year, and so does cutting a long flight.
| Action | Tonnes CO2e saved a year | Study |
|---|---|---|
| Live car-free | 2.4 (1.0 to 5.3) | Wynes and Nicholas 2017 |
| Skip one round-trip transatlantic flight | 1.6 (0.7 to 2.8) | Wynes and Nicholas 2017 |
| Switch home electricity to renewables | 1.6 | Ivanova et al. 2020 (median) |
| Buy a more fuel-efficient car | 1.19 | Wynes and Nicholas 2017 |
| Refurbish and renovate the home | 0.9 | Ivanova et al. 2020 (median) |
| Eat a plant-based diet | 0.8 (0.3 to 1.6) | Wynes and Nicholas 2017 |
| Throw away no food | 0.37 | Wynes and Nicholas 2017 |
| Eat less meat | 0.23 | Wynes and Nicholas 2017 |
| Hang-dry clothes | 0.21 | Wynes and Nicholas 2017 |
| Recycle comprehensively | 0.21 | Wynes and Nicholas 2017 |
| Insulate walls | 0.18 | Wynes and Nicholas 2017 |
| Use a reusable shopping bag | 0.005 | Wynes and Nicholas 2017 |
Source: Wynes and Nicholas (2017) and Ivanova et al. (2020), both published in Environmental Research Letters. The Wynes and Nicholas figures for the smaller actions are converted from kilograms in the paper’s Table 1, and the options aren’t additive.
Of the home options, renewable electricity saves a median 1.6 tonnes of CO2e per person a year and refurbishment 0.9. If your next big purchase is a car or a heating system, our pages on electric cars in the US and how a heat pump works cover what each one costs.
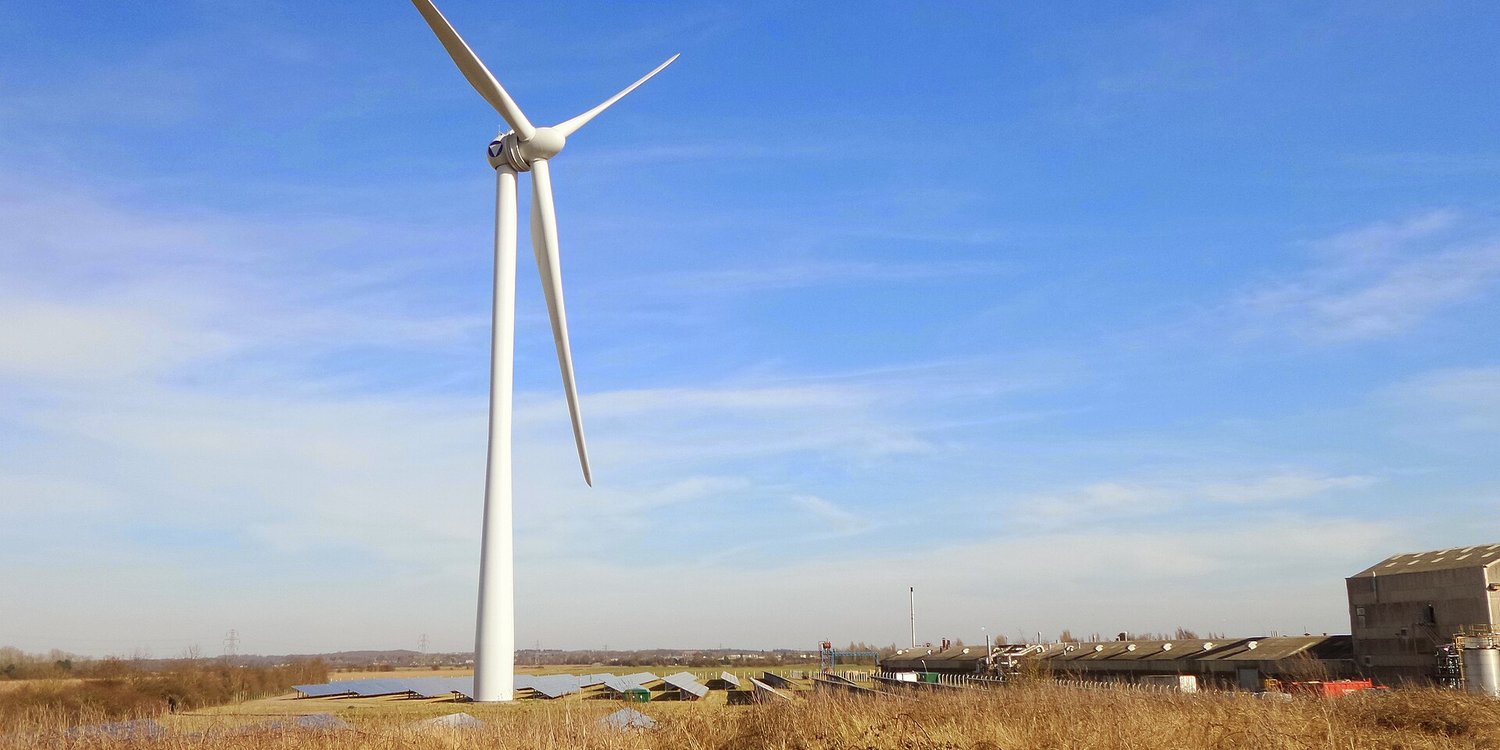
Top photo: Martin Pearman, CC BY-SA 2.0, via Wikimedia Commons, cropped.