Originally published March 20, 2013. Updated September 28, 2026.
More than 175,000 natural gas vehicles run in the US, and the fuel behind them still costs about a quarter less than gasoline at the pump. That price gap never built a mass market here.
Pakistan and Iran turned to compressed natural gas on a national scale decades ago, and Italy built pumps to match. The US mostly stuck with fleets that fuel at their own depot, like buses and delivery trucks.
If you already drive a natural gas vehicle, that price gap shows up every time you fill up. If you don’t, you’ll see why below.
Natural gas vehicles in the US today
The US counted 1,385 CNG stations and 81 LNG stations in 2025, next to 85,692 public EV charging ports that same year. The refueling network has moved backward since its mid-2010s peak. The same DOE page reports that CNG station counts fell after 2016, as some stations closed and fleets moved on to other fuels.
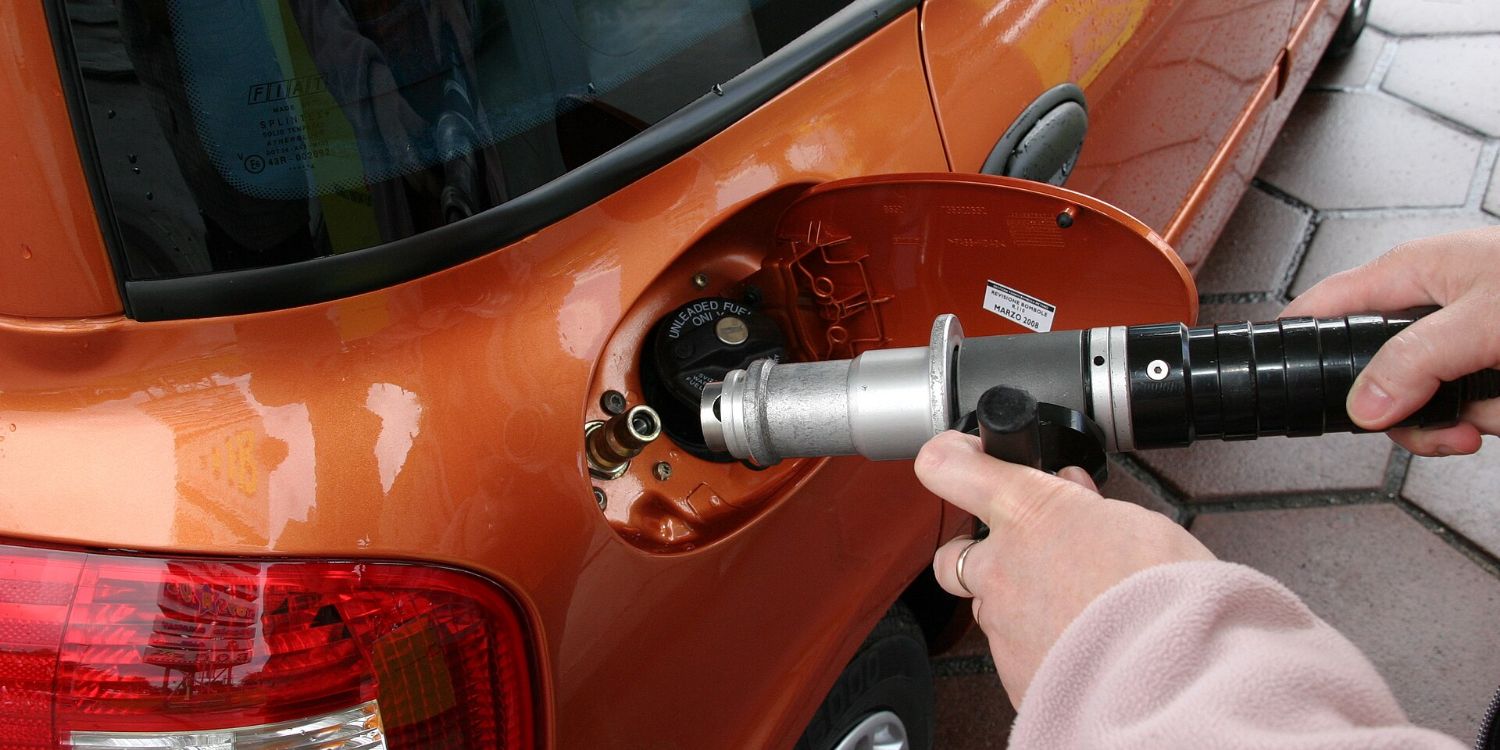
A CNG tank holds its fuel at up to 3,600 pounds per square inch, squeezed into a thick steel cylinder that eats up much of a trunk or a pickup bed. That’s the tradeoff a natural gas vehicle asks you to make. You get less room to haul your stuff, in exchange for a cheaper fill-up.
Most of the gas moving through those stations comes from domestic shale production. Our explainer on fracking water use covers that supply side.
What CNG costs compared with gasoline
As of April 2026, retail CNG averaged $3.08 per gasoline-gallon-equivalent nationwide, against $4.09 for a gallon of gasoline. That’s a gap of about $1.01 per GGE, roughly a quarter less than gasoline.
Fill up at a CNG pump instead of a gas pump, and you’d see that gap every time the pump shuts off. The sticker price doesn’t reflect it, and neither does the extra distance you might drive hunting for a station. Short errands around town make the fuel savings add up slowly. Driving the same route all day for work makes them add up fast.
One gasoline-gallon-equivalent works out to 5.66 pounds of compressed natural gas, the conversion the Department of Energy uses to compare the two fuels on one scale. Without it, a price quoted in dollars per hundred cubic feet wouldn’t tell you anything about miles per dollar.
Why the US share stayed so small
In 2023, transportation used about 4% of all US natural gas, and 96% of that went to power pipeline compressors, not vehicles. Nearly all the natural gas that vehicles do burn runs through government and private fleets using CNG or LNG, per the same source. If your town runs its buses or utility trucks on natural gas, that fleet is most of the country’s natural-gas-vehicle story right there.
Natural gas, a fossil fuel, has counted as a federally tracked alternative transportation fuel for decades, alongside hydrogen fuel and propane, but the market under it never grew the way Pakistan’s, Iran’s or Italy’s did.
Where natural gas trucks and buses still make sense
Natural gas engines still pencil out in vehicles that return to the same yard every night and run high mileage all day. The DOE’s Alternative Fuels Data Center points to that profile in refuse trucks and transit buses, which fuel at a central depot instead of hunting for a public station. Watch a garbage truck or a transit bus pull away from a curb, and there’s a decent chance it runs on natural gas fueled at its own depot, never at a pump you’d recognize.
Heavy trucks more often run on LNG than CNG. The Class 7 and 8 rigs that haul regional freight fit that pattern, per the same AFDC source, because they fuel at their own depots instead of at a retail pump. Only 81 LNG stations serve the whole country, a shortage that matters far less to a fleet fueling at its own depot than to you if you’re hunting for a public pump.
Where CNG fleets got built decades before the US caught on
Natural gas vehicles made up roughly 80% of Pakistan’s vehicle fleet by 2013, more than 2 million vehicles running on compressed natural gas, according to Geoffrey Styles’ account on his blog Energy Outlook. He linked that to Pakistan’s push to cut its dependence on imported petroleum.
Iran’s CNG adoption ran higher still. Styles attributed it to international sanctions that restricted imports of gasoline and other refined fuels, which left Iranian drivers running on whatever fuel their own refineries could still produce. No public, sourced count newer than Styles’ 2013 figures turned up for either country’s fleet size.
Italy built its own natural gas car culture the same way. Styles reported that more than 11% of new cars sold in Italy in 2012 were natural-gas-capable, against 0.01% in the US that same year. Italy backed those sales with a government purchase subsidy of about €700, worth roughly $945 at the 2013 exchange rate. The country also ran more than 40% more CNG stations than the entire US, even though Italy had 83% fewer vehicles overall.
Both figures date to 2012 and 2013. Nobody has published a newer count of Italy’s natural gas fleet since.
The price gap that favors CNG today isn’t new either. In 2011, wholesale natural gas cost under $0.60 per gasoline-gallon-equivalent, while retail CNG ran under $2.00 per GGE in many parts of the country, according to Styles’ 2013 account. Even at that price, natural gas made up less than 3% of US transportation energy that year. Cheap fuel alone never built a fleet here the way it did in Pakistan and Iran.
Where EVs pulled ahead of natural gas
Per the IEA’s count, the world sold more than 17 million electric vehicles in 2024, over 20% of new cars sold that year. That single year of global sales of electric cars already dwarfs Pakistan’s and Iran’s combined CNG fleets from Styles’ 2013 count.
China shows the pace clearest. More than 11 million EVs sold there in 2024, about half the country’s new car sales, and 1 in 10 cars on Chinese roads is now electric. In the US, where natural gas never moved past a niche, more than 1 in 10 new cars sold in 2024 were electric. The battery energy storage explainer covers how much cheaper batteries got over that same stretch.
If you’re weighing an alternative to gasoline for your next vehicle, our explainer on electric vehicle adoption covers what’s driving the numbers above and what they could mean for the next vehicle you buy.