Energy comes in two basic forms, potential and kinetic, and the US runs mostly on petroleum and natural gas, which together supplied 73% of its primary energy in 2025. Both fuels store chemical energy in their molecules, so every tank of gasoline and every gas flame is stored energy turning into heat and motion. The figures come mostly from EIA and Ember, plus the Energy Institute and Lawrence Livermore National Laboratory, and they describe 2025 unless a line says otherwise.
Top types of energy statistics
- EIA lists 9 forms of energy, all of them either potential or kinetic.
- The US used 96.5 quadrillion Btu of primary energy in 2025, and petroleum and natural gas supplied 36.1 and 34.6 of those quads.
- Coal’s share of US energy fell from about 37% in 1950 to 9% in 2025.
- Of the 94.6 quads Americans used in 2024, Lawrence Livermore’s flow chart shows 62.27 quads rejected as waste heat.
- Fossil fuels supplied 86% of the world’s total energy supply in 2025, according to the Energy Institute.
- Renewables made 33.8% of world electricity in 2025 and edged past coal at 33.0%.
- Solar generation reached 2,778 TWh worldwide in 2025, up 30% on 2024.
- Nuclear plants ran at maximum power more than 92% of the time in a 2021 DOE comparison.
What are the forms of energy?
Every form of energy is either potential or kinetic, EIA says, which means it’s either stored or moving. Potential energy is stored energy and the energy of position. Kinetic energy is the motion of waves, electrons, atoms, molecules and objects.
| Form | Class | EIA’s everyday example | Energy source it matches |
|---|---|---|---|
| Chemical | Potential | Battery, wood, gasoline | Petroleum, natural gas, coal, biomass |
| Stored mechanical | Potential | Compressed spring | None listed |
| Nuclear | Potential | Energy holding a nucleus together | Uranium |
| Gravitational | Potential | Bicycle at the top of a hill | Hydropower |
| Radiant | Kinetic | Sunshine | Solar |
| Thermal | Kinetic | Heat from burning wood | Geothermal |
| Motion | Kinetic | Wind, a moving car | Wind |
| Sound | Kinetic | A vibrating object | None listed |
| Electrical | Kinetic | Lightning | Electricity |
Source: EIA, Forms of energy. The last column follows the examples on that page and on EIA’s sources of energy page.
Energy changes form all the time, but it never disappears. A car engine turns the chemical energy in gasoline into mechanical energy, and a solar cell turns radiant energy from the sun into electricity.
Ride a bicycle down a hill and the gravitational energy you held at the crest turns into motion. The Sun reaches into more than one row of the table. Without its energy, life as we know it could not exist, and DOE says wind is a form of solar energy.
What’s the difference between renewable and nonrenewable energy?
Renewable sources are naturally replenished, while nonrenewable ones are mined or pulled from the earth, according to EIA’s energy mix overview. EIA’s five major renewable energy sources are the sun, heat inside the earth, wind, plants and flowing water.
Petroleum, hydrocarbon gas liquids, natural gas, coal and nuclear energy are the nonrenewable ones. Uranium counts as nonrenewable even though it’s a common metal in rocks worldwide.
Primary sources are fuels in their original form, and secondary sources such as electricity and hydrogen are made from them. People relied mostly on traditional biomass until the mid-19th century, and coal, oil and natural gas came to dominate after that.
Which energy sources does the US use the most?
Petroleum supplied 36.1 quadrillion Btu and natural gas 34.6 of the 96.5 quads the US used in 2025, which makes them a little under three-quarters of the total.
| Source | Class | Consumption (quads, 2025) | Share of total (%) |
|---|---|---|---|
| Petroleum | Fossil | 36.115 | 37.4 |
| Natural gas | Fossil | 34.624 | 35.9 |
| Coal | Fossil | 8.671 | 9.0 |
| Nuclear | Nuclear | 8.195 | 8.5 |
| Biomass | Renewable | 4.853 | 5.0 |
| Wind | Renewable | 1.585 | 1.6 |
| Solar | Renewable | 1.438 | 1.5 |
| Hydropower | Renewable | 0.843 | 0.9 |
| Geothermal | Renewable | 0.117 | 0.1 |
| Total | 96.466 | 100 |
Source: EIA, Monthly Energy Review Table 1.3. Shares are computed from EIA’s figures. Since October 2023, EIA has counted wind, solar, hydropower and geothermal at the heat content of the electricity they make.
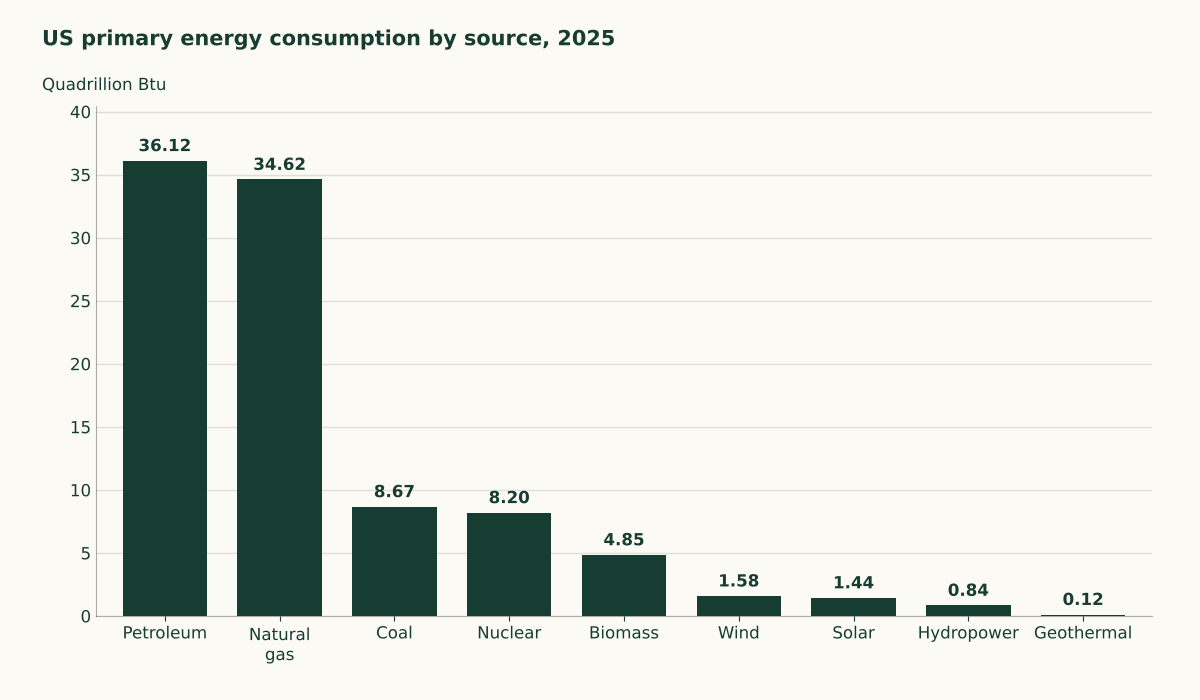
If you drive, you’re in the petroleum bar. EIA says petroleum is the primary fuel in the transportation sector.
Lawrence Livermore’s chart for 2024 shows the same order, and it counts coal at 7.9 quads, the lowest in EIA’s series, which starts in 1949.
How has the US energy mix changed?
Coal and petroleum have traded places with natural gas and solar over the past two decades, and the table shows it year by year.
| Year | Petroleum (quads) | Natural gas (quads) | Coal (quads) | Nuclear (quads) | Wind (quads) | Solar (quads) | Total (quads) |
|---|---|---|---|---|---|---|---|
| 2005 | 40.217 | 22.565 | 22.797 | 8.161 | 0.061 | 0.052 | 98.101 |
| 2015 | 35.368 | 28.191 | 15.549 | 8.337 | 0.651 | 0.197 | 94.478 |
| 2016 | 35.712 | 28.4 | 14.226 | 8.427 | 0.774 | 0.252 | 94.084 |
| 2017 | 36.043 | 28.049 | 13.837 | 8.419 | 0.868 | 0.331 | 93.889 |
| 2018 | 36.892 | 31.163 | 13.252 | 8.438 | 0.93 | 0.388 | 97.4 |
| 2019 | 36.866 | 32.264 | 11.316 | 8.452 | 1.01 | 0.435 | 96.6 |
| 2020 | 32.331 | 31.669 | 9.181 | 8.251 | 1.153 | 0.516 | 88.877 |
| 2021 | 35.243 | 31.711 | 10.549 | 8.131 | 1.29 | 0.636 | 93.375 |
| 2022 | 35.319 | 33.379 | 9.888 | 8.061 | 1.482 | 0.784 | 94.964 |
| 2023 | 35.448 | 33.676 | 8.171 | 8.099 | 1.437 | 0.907 | 93.746 |
| 2024 | 35.59 | 34.179 | 7.912 | 8.165 | 1.542 | 1.138 | 94.582 |
| 2025 | 36.115 | 34.624 | 8.671 | 8.195 | 1.585 | 1.438 | 96.466 |
Source: EIA, Monthly Energy Review Table 1.3. Every year uses EIA’s current method for wind, solar and hydropower.
Total US use hit a record of about 99 quads in 2007, and 2025 came in below it. Coal’s decline is the steepest in the table, from 22.8 quads in 2005 to 8.7 in 2025, and the 2025 uptick was its first rise since 2021.
Solar climbed quickly too. Ember counted US solar generation rising from 39 TWh in 2015 to 389 TWh in 2025, including small-scale panels.
How much of the energy the US uses is wasted?
About two-thirds of the energy the US used in 2024 was rejected, going by Lawrence Livermore’s flow chart. That rejected energy ends up as waste heat released into the environment.
| Stage | Energy in (quads, 2024) | Rejected (quads) | Output (quads) |
|---|---|---|---|
| Power plants | 32.77 | 19.21 | 13.56 |
| Residential | 11.23 | 3.93 | 7.3 |
| Commercial | 9.49 | 3.32 | 6.17 |
| Industrial | 26.39 | 13.46 | 12.93 |
| Transportation | 28.29 | 22.35 | 5.94 |
Source: Lawrence Livermore National Laboratory, 2024 US energy flow chart. Output for power plants is electricity delivered, and output for the four sectors is energy services. Sector rows include the electricity they buy, and the lab estimates end-use efficiency by sector.
In the transportation row, the rejected column dwarfs the output column. Power plants lose energy too. A plant that burns 10,500 Btu to make one kWh of electricity is 33% efficient, and the rest is heat.
What are the world’s main energy sources?
Fossil fuels supplied 86% of the world’s total energy supply in 2025, which passed 600 exajoules for the first time, the Energy Institute reports.
| Source | Share in 2020 (%) | Share in 2025 (%) |
|---|---|---|
| Oil | 33.6 | 33.5 |
| Coal | 28.3 | 27.7 |
| Natural gas | 25.6 | 25.1 |
| All fossil fuels | 87.5 | 86.3 |
| Nuclear | 5.8 | 5.2 |
| Hydropower | 2.8 | 2.7 |
| Wind, solar, biomass and geothermal | 3.9 | 5.9 |
Source: Energy Institute, Statistical Review of World Energy 2026, as tabulated by Cyprus Mail. Shares are of total energy supply on the Energy Institute’s physical energy content basis.
Wind, solar, biomass and geothermal together gained 2 percentage points in five years, and nuclear slipped 0.6 points. Solar alone supplied 1.7% of the world total and wind 1.6% in 2025.
For scale, the EU’s gross available energy was 55,790 petajoules in 2024. Eurostat counts gross available energy, which isn’t the same measure as US primary energy, so the two don’t line up.
How is the world’s electricity made?
Coal made 33.2% of world electricity in 2025, with gas at 21.7% and hydropower at 13.9% in Ember’s yearly data. The mix looks nothing like the energy mix above, because electricity is only 19.3% of world total energy supply.
| Source | World electricity (%, 2025) | US electricity (%, 2025) |
|---|---|---|
| Coal | 33.2 | 16.3 |
| Natural gas | 21.7 | 40.0 |
| Nuclear | 8.8 | 17.4 |
| Hydropower | 13.9 | 5.3 |
| Wind | 8.5 | 10.3 |
| Solar | 8.8 | 8.6 |
| Bioenergy | 2.0 | 1.0 |
Source: Ember, yearly electricity data. Ember’s US shares include small-scale solar, so they differ slightly from EIA’s utility-scale shares.
EIA puts natural gas at about 41% of US utility-scale generation in 2025, and fossil fuels at about 58%. The power plants behind your outlet run on a different mix from the fuel in your tank, and EPA says they use a wide variety of energy resources.
How does each energy source make power?
US crude oil production feeds refineries that turn crude into gasoline and diesel, and a 42-gallon barrel yields about 45 gallons of products, the way popcorn grows when it pops.
Natural gas as a fuel burns in steam turbines and gas turbines, and it was the top US electricity source in 2025 at about 41% of utility-scale generation.
Coal is a fossil fuel, so it took thousands of years to form from buried remains. How coal forms explains the layers, and the US has moved off it fast enough that coal shows up as a small slice in the table above.
Nuclear plants split uranium atoms to make heat, and the US nuclear fleet supplied about 18% of US electricity in 2025. Worldwide, nuclear provides about 9% of electricity from about 440 reactors, says the World Nuclear Association, a trade group.
Hydropower plants use gravity to push water through turbines. DOE calls hydropower one of the oldest and largest renewable sources, and it made 5.6% of US generation in 2025.
Wind turns blades around a rotor that spins a generator, and wind power’s growth has put it ahead of hydropower in the US column of the Ember table above.
DOE names photovoltaics and concentrating solar-thermal power as the main solar technologies. Solar’s growth shows in the US history table, where it climbed every year.
Geothermal power draws on heat from the earth, and DOE defines geothermal as heat energy from the earth. It’s the smallest line in the US table.
Biomass energy comes from recently living organic material, and EIA says it was about 5% of US primary energy in 2025.
Where these numbers come from
We computed the US shares by dividing each source’s 2025 quads by the table total. EIA counts wind, solar, hydropower and geothermal at the heat content of the electricity they make. Its old fossil fuel equivalence method had put noncombustible renewables at 15% of power-sector energy in 2018 instead of 6%.
The Energy Institute also dropped its substitution method, which inflated renewables by about 2.5 times, so the world table is on the newer basis and older pages show different shares. Ember’s April report and its later data file differ slightly, so the tables use the file.
Where solar and wind are set to overtake nuclear
Ember expects both solar and wind to overtake nuclear in world electricity in 2026.
As of November 2026, EIA’s Short-Term Energy Outlook expects most US generation growth through 2027 to come from utility-scale solar plants.